LLM Resources Metrics and Usage Monitoring
The LLM Resources metrics dashboard provides comprehensive visibility into your tenant’s Large Language Model (LLM) consumption, execution patterns, and performance behavior. It enables administrators to monitor token usage, track call volumes, analyze error rates, and optimize resource allocation across configured LLM endpoints.
Access LLM resource metrics
You can inspect LLM resource metrics through two primary views:
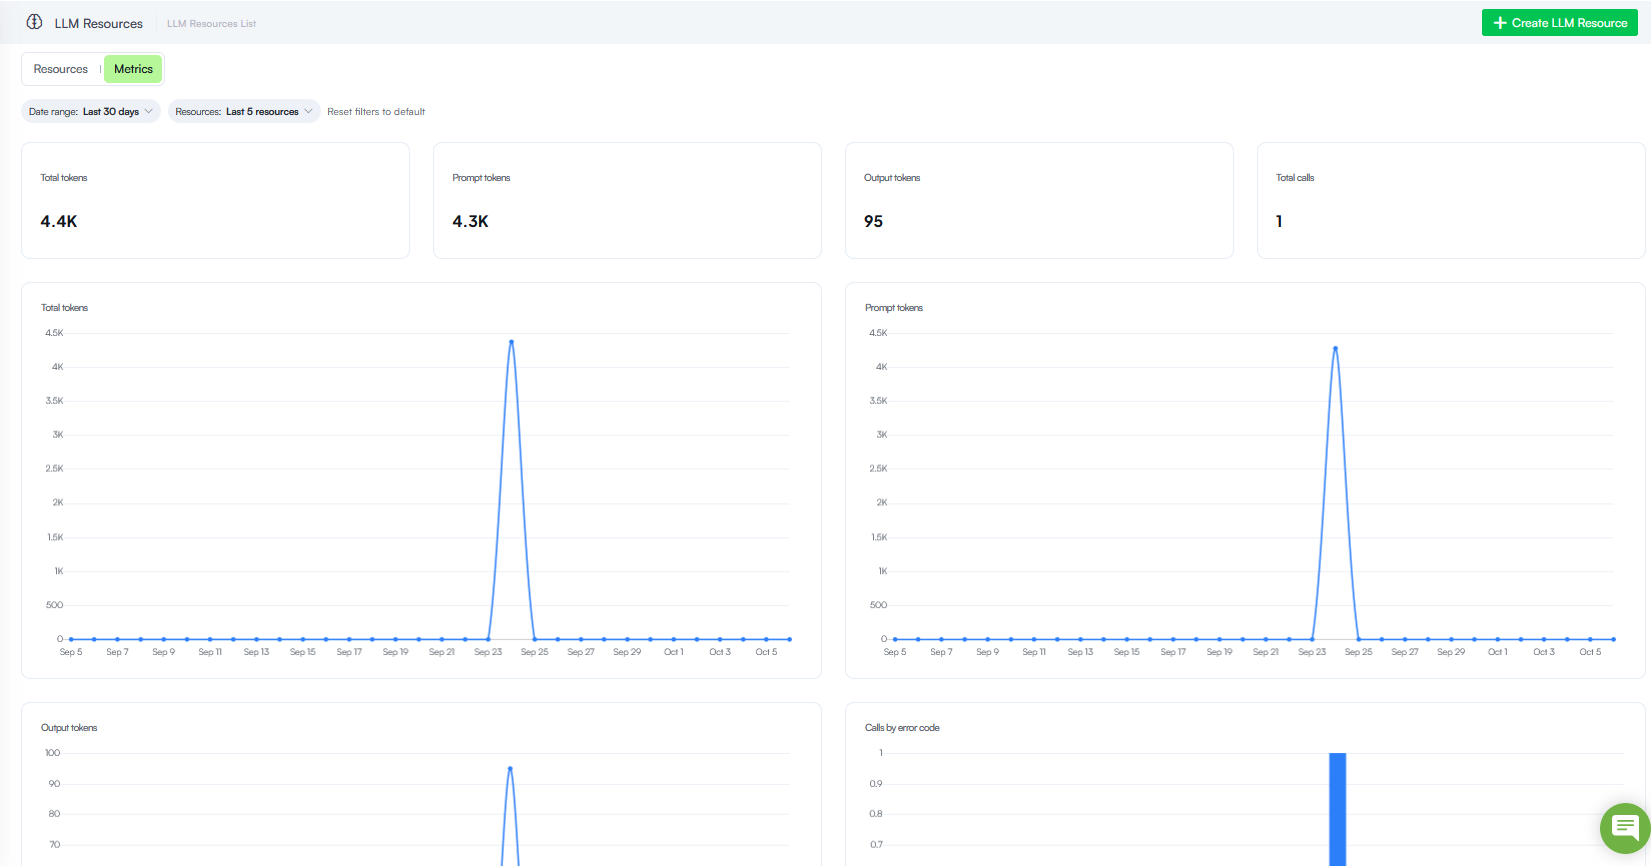
- Global metrics. Navigate to Administration > LLM Resources and click the Metrics tab.
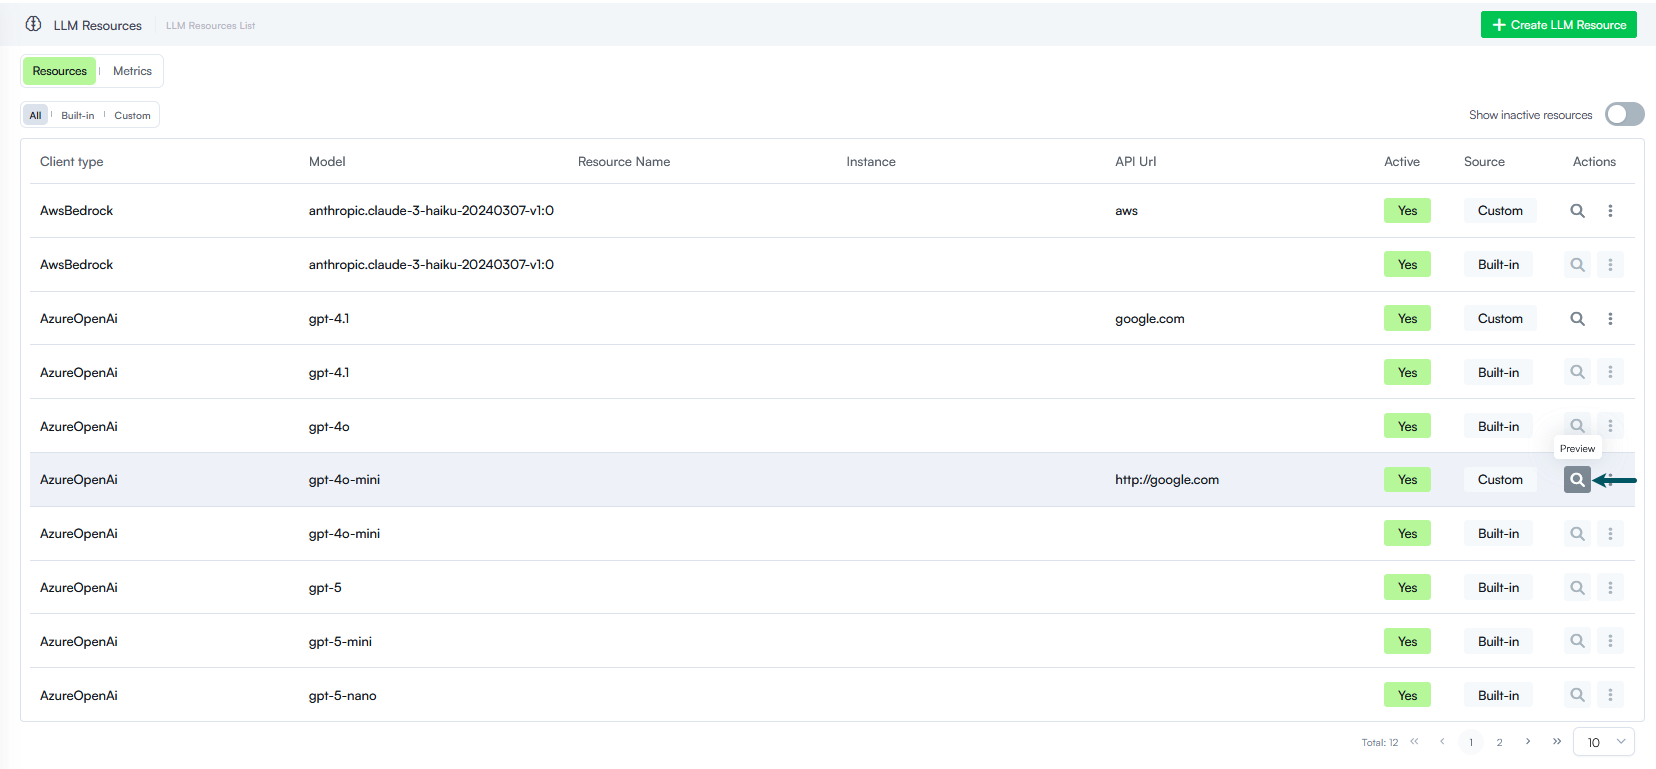
- Individual resource metrics. Navigate to Administration > Speech Resources and on the Resources page, click the Preview icon in line with the resource. The page opens the Metrics tab filtered specifically for that selected resource.
Filter Options
At the top of the dashboard, you can filter and scope the displayed metrics using the following options:
-
Date range. Select the time window for the reported telemetry (e.g., Last 30 days).
-
Resources. Filter usage statistics by specific LLM resource endpoints (e.g., Last 5 resources or a customized selection).
-
Reset filters to default. Quickly revert all applied filters back to their default states.
Metrics reference
The Metrics dashboard contains four summary KPI cards at the top and four charts.
Summary KPIs
The top section of the dashboard displays key performance indicators summarizing aggregate consumption over the selected period.

| KPI | Unit | Description |
|---|---|---|
| Total tokens | The combined total of input and output tokens consumed across all LLM calls. | |
| Prompt tokens | The total number of tokens sent in prompts/inputs to the LLM resources. | |
| Output tokens | The total number of tokens generated as responses by the LLM resources. | |
| Total calls | The overall number of requests made to the configured LLM resources. |
Detailed Metrics Charts
The lower section of the dashboard features chronological charts and breakdowns to help analyze usage trends and diagnose issues.
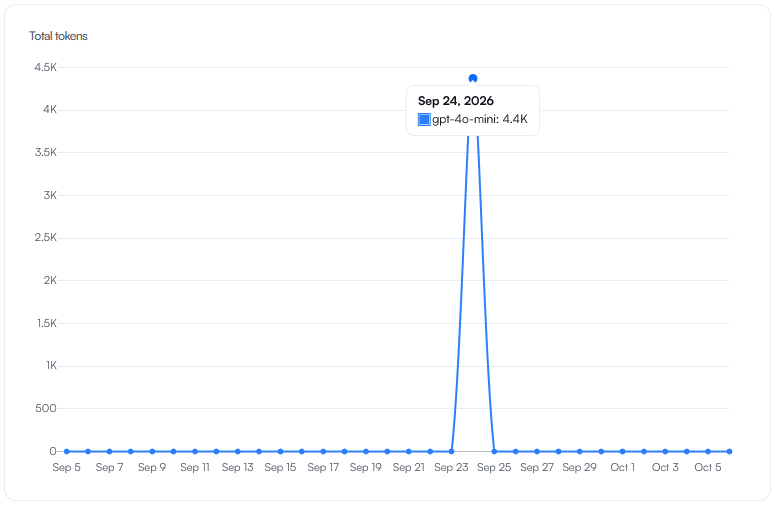
Total tokens Chart
A time-series graph displaying the daily distribution of total token consumption, allowing you to identify peak usage spikes.
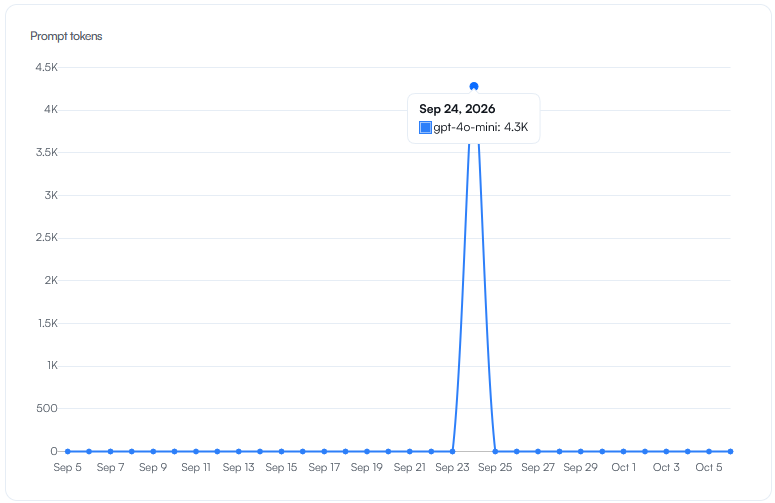
Prompt tokens Chart
A time-series graph tracking the volume of prompt tokens sent over the selected time range.
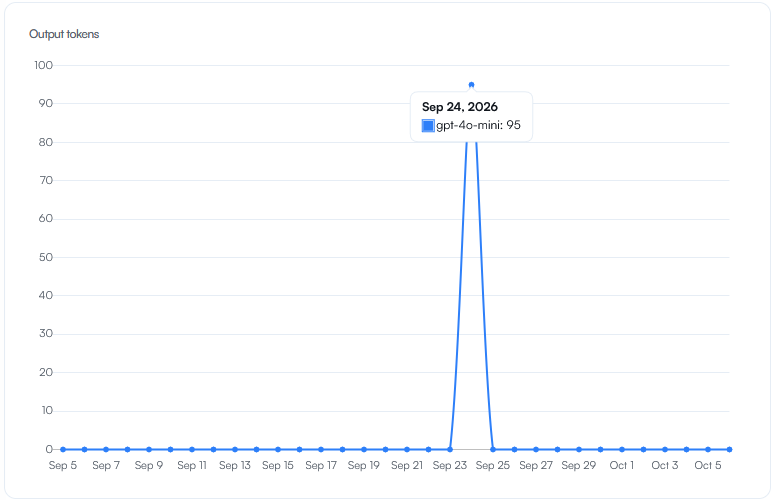
Output tokens Chart
A time-series graph monitoring response generation volume over time.
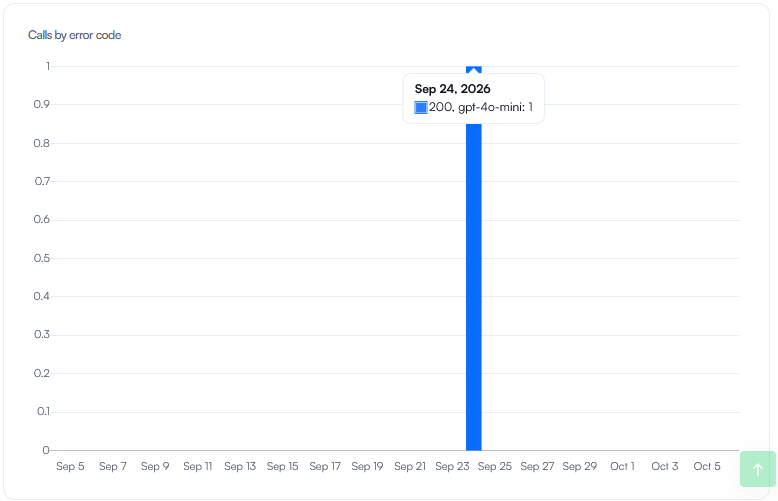
Calls by error code Chart
A bar chart illustrating the volume of LLM calls categorized by error codes or failure types, helping you quickly spot and troubleshoot integration issues or failed requests.