Live Dashboard
The Live Dashboard provides helpdesk managers with an overview on how helpdesk agents are performing at any given moment. It offers real-time metrics that help managers analyze the contact center queues performance and track their agents’ efficiency in real time.
Enable Live Dashboard
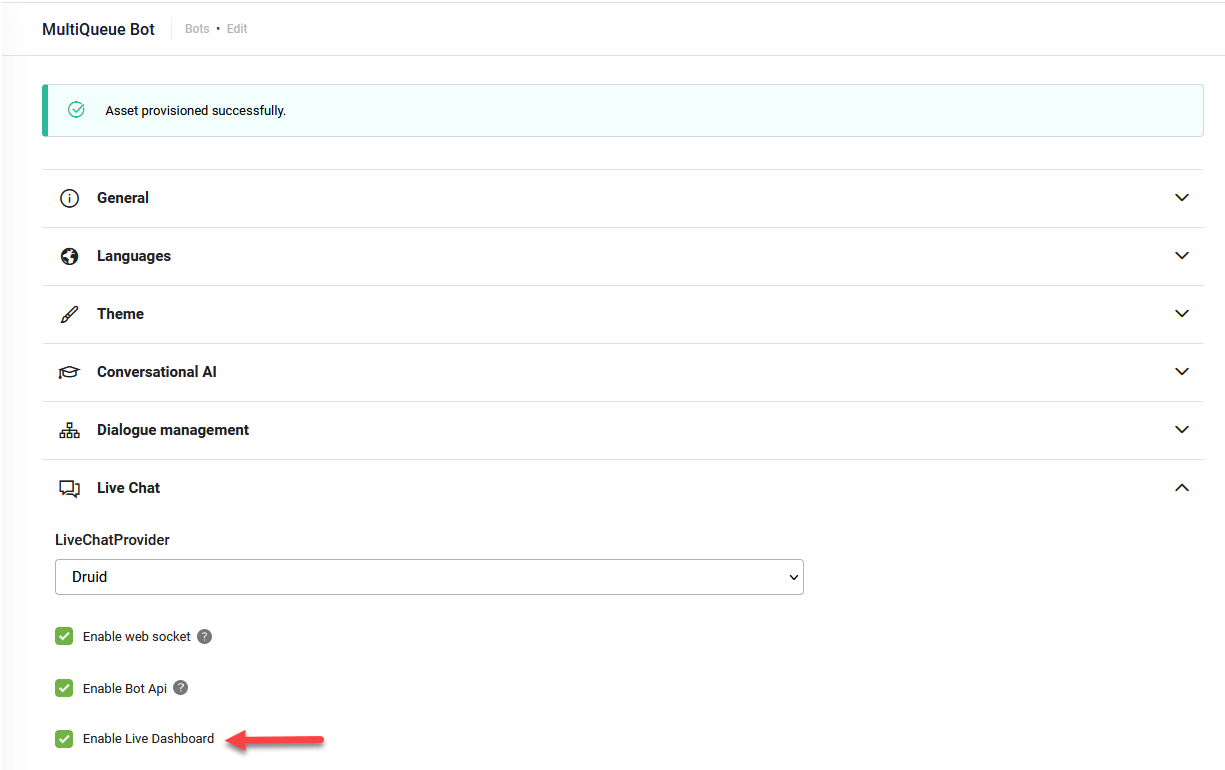
To activate Live Dashboard for your AI Agent, go to the AI Agent settings, Details tab. Click on the Live Chat section header and select Enable Live Dashboard.
Access the Live Dashboard
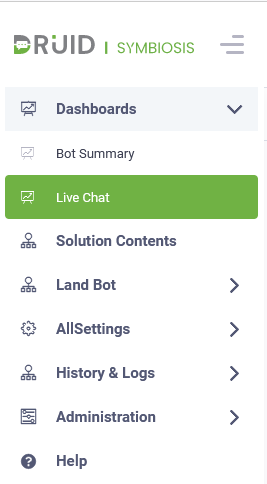
To access the Live Dashboard, on the Dashboards menu, click Live Chat.
When accessing the Live Dashboard for the first time, it contains only one page, Live Chat with two empty widgets and an empty view.
You can configure the Live Dashboard as best suits your needs.
Configure the Live Dashboard
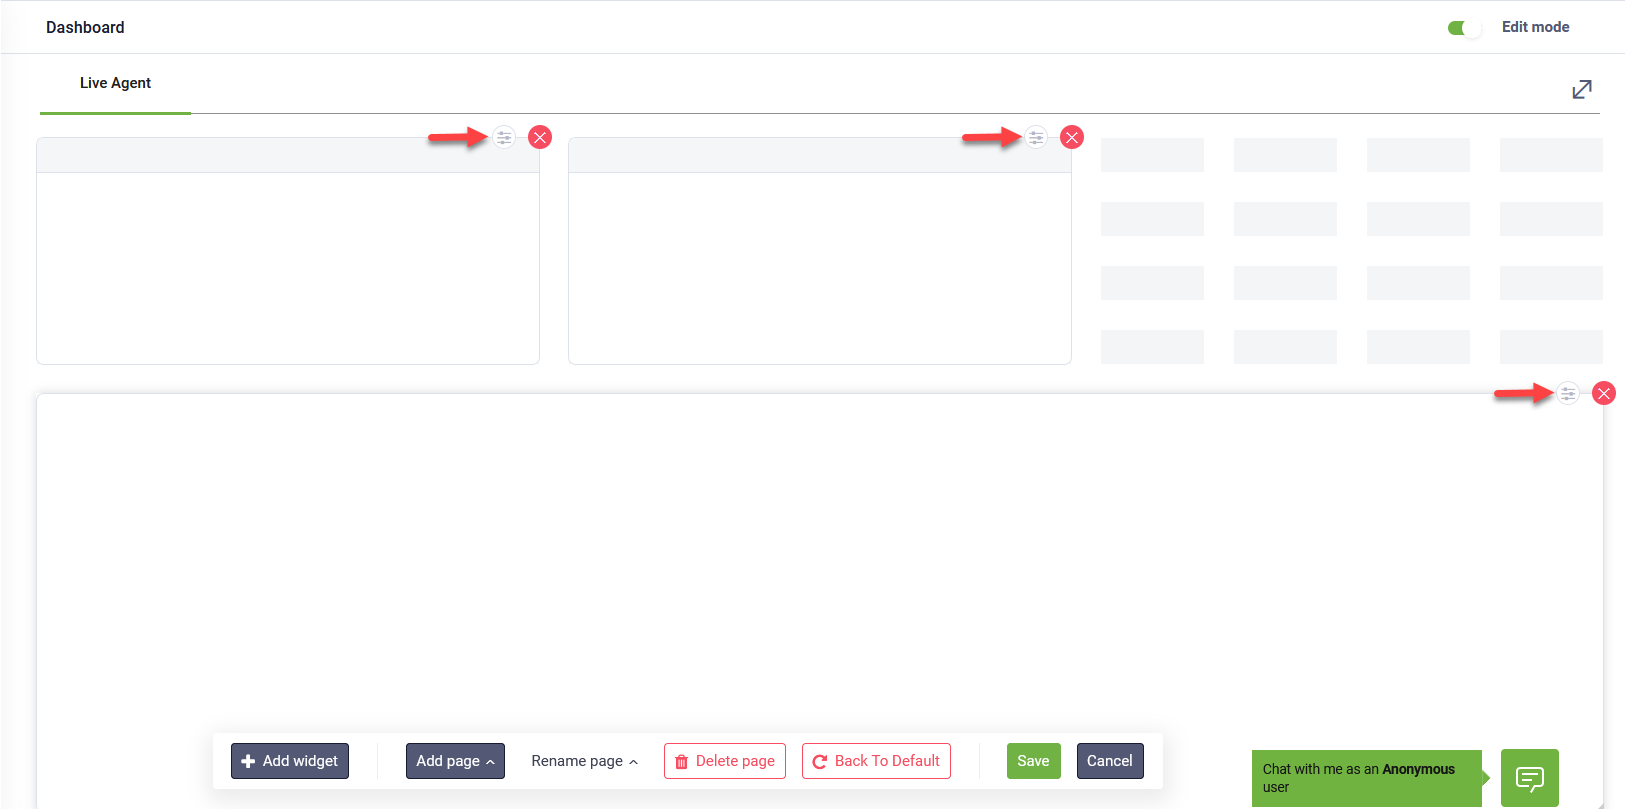
To edit Live Dashboard, on the top-right corner, tap on Edit mode. The Live Dashboard becomes editable: a toolbar appears at the bottom and all dashboard widgets become editable.
You can navigate through dashboard pages and edit the dashboard pages according to your needs.
The toolbar provides you with the following options:
|
|
Add a new dashboard page. Useful when you want to have your custom KPIs on the same page. |
|
|
Rename the current dashboard page. |
|
|
Delete the current dashboard page. IMPORTANT! This action cannot be undone. Make sure that you really want to delete the current dashboard page.
|
|
|
Restores the current page to default dashboard template that contains only the Live Chat page with the two empty widgets and an empty view. IMPORTANT! This action cannot be undone; any customizations you did to the current page or to other pages will be lost! Make sure that you really want to restore the dashboard page to default.
|
|
|
Saves the current dashboard page customization and exists the edit mode. |
|
|
Cancels dashboard page customizations (new or existing widgets, reordering, etc.) and exists the edit mode. |


Adding widgets
To add a widget, click the Add widget button ( ) on the toolbar. The Add widget page appears.
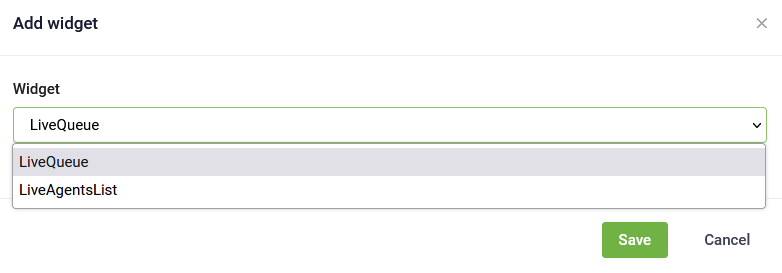
Select the desired widget type:
-
LiveQueue –a snapshot of the basic information required to track the performance of a queue.
-
LiveAgentsList - show agents’ activity connected to all the queues defined in the system to help you track their efficiency.
Click Save. The widgets are empty and require configuration.
You need to edit the widget based on the selected widget type. The next section describes how to edit the two types of widgets.
Configuring widgets
To edit a widget, click the settings icon corresponding to the desired widget.
The widget Settings page appears. The page content is different based on the widget type. This section provides you with information on how to set up new widgets based on their type.
Configuring LiveQueue
In the Settings page, select the Queue and from the Information displayed drop-down, select the information you want to see for the selected queue.
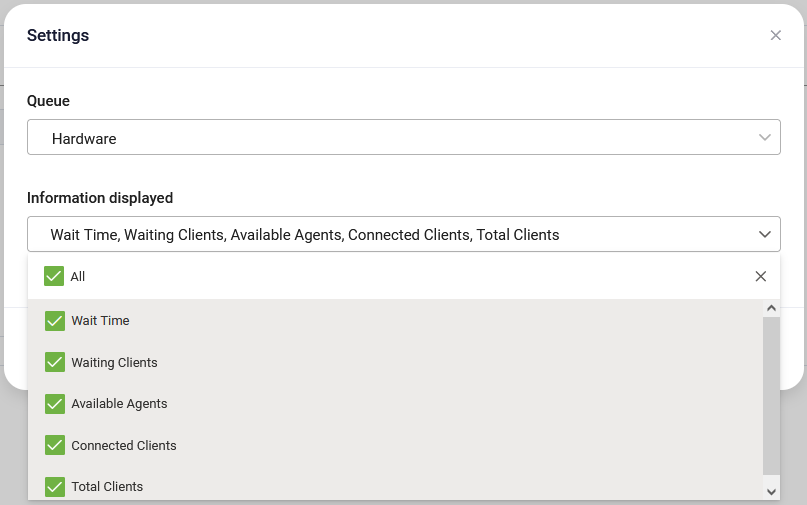
You can do multiple select to display on the widget the following information related to the selected queue:
|
Field |
Description |
|---|---|
|
Wait Time |
The average time a client is waiting in the queue until an agent picks up the call. |
|
Waiting Clients |
The number of clients waiting in the queue for an agent to pick up the call. |
|
Available Agents |
The number of agents connected to the queue available to receive calls. |
|
Connected Clients |
The number of clients connected in live chat calls with helpdesk agents in the current queue. |
|
Total Clients |
The sum between the number of clients waiting for an agent to pick up the call and the number of clients connected in live chat calls with helpdesk agents in the queue. |
Configuring LiveAgentsList
The agents’ activity view provides data that helpdesk managers can use to analyze in real-time the activity and performance of helpdesk agents assigned to the queues selected on the current dashboard page.
In the Settings page, from the Information displayed drop-down, select the information you want to view for the agents in the queues selected on the current dashboard page.
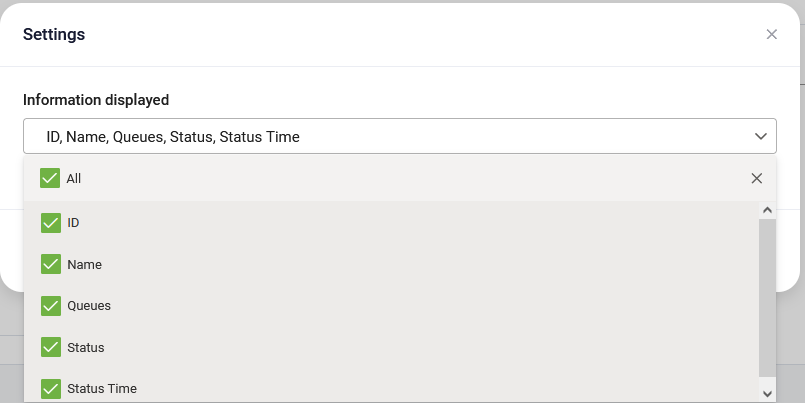
You can do multiple select to display the following information:
|
Field |
Description |
|---|---|
|
ID |
The ID of the helpdesk agent. |
|
Name |
The name of the helpdesk agent. |
|
Queues |
The number of the queue(s) the online agent is allocated to, including the general waiting queue. |
|
Status |
The status of the agent in the queue. An agent can have one of the following statuses:
|
|
Status Time |
The time elapsed since the agent is in the status. |
| Connected Queues | The list of queues to which the client is connected. |
| Number of Conversations (per day) |
The total count of live chat conversations an agent has participated in throughout the current day. This metric tracks agent workload volume. NOTE: This metric is available starting with Druid 9.20.
|
| Total Conversations (per day) |
The cumulative duration of all live chat conversations an agent has handled during the current day. This metric tracks total time spent in active engagement. NOTE: This metric is available starting with Druid 9.20.
|
| Take agent offline |
On button click, takes the helpdesk agent offline. This action requires a specific configuration. For more information, see Enabling Managers to Disconnect Helpdesk Agents. |
Deleting widgets
To delete a widget from the current dashboard page, click the delete icon corresponding to the desired widget.
Reordering widgets on Dashboard
You can reorder the widgets on a dashboard page by using drag and drop and clicking the Save button on the toolbar.
Adding Live Dashboard Pages
You can track the performance of the different queues and agents assigned to those queues based on your needs by adding multiple pages to the Live Dashboard.
To add a new dashboard page, click the Add page button ( ) from the toolbar. A pop-up appears. Type the name of the page and click Save.
The page appears as a new tab to the dashboard but you remain on the current page.
Renaming Dashboard Pages
To rename the current dashboard page, click the Rename page button ( ) on the toolbar. A pop-up appears. Type the new name of the page and click Save.
The new page name is saved.
Deleting Dashboard Pages
To delete the current dashboard page, click the Delete page button (  ) from the toolbar. A confirmation dialog appears.
Click Yes. The current page is removed from the dashboard and the Live Chat dashboard page appears (in edit mode).
Restore to Dashboard template page
You can restore a customized dashboard page back to the dashboard template page by selecting the desired page (dashboard tab) and clicking the Back to Default button from the toolbar.
A pop appears asking you to confirm the action. Click Yes.