Customizing Dashboard Template
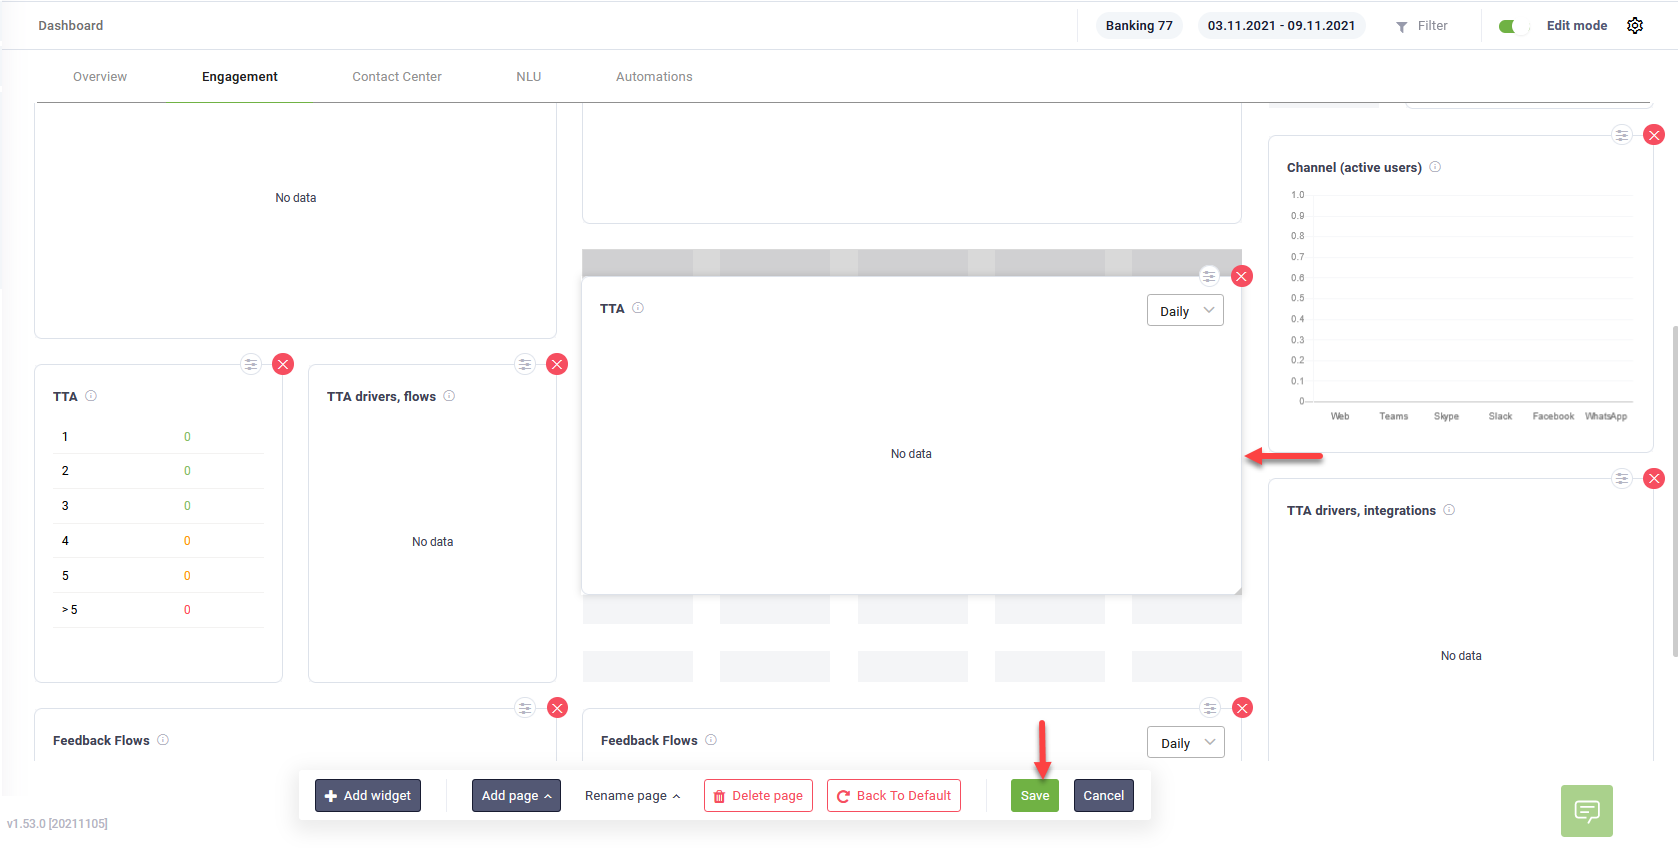
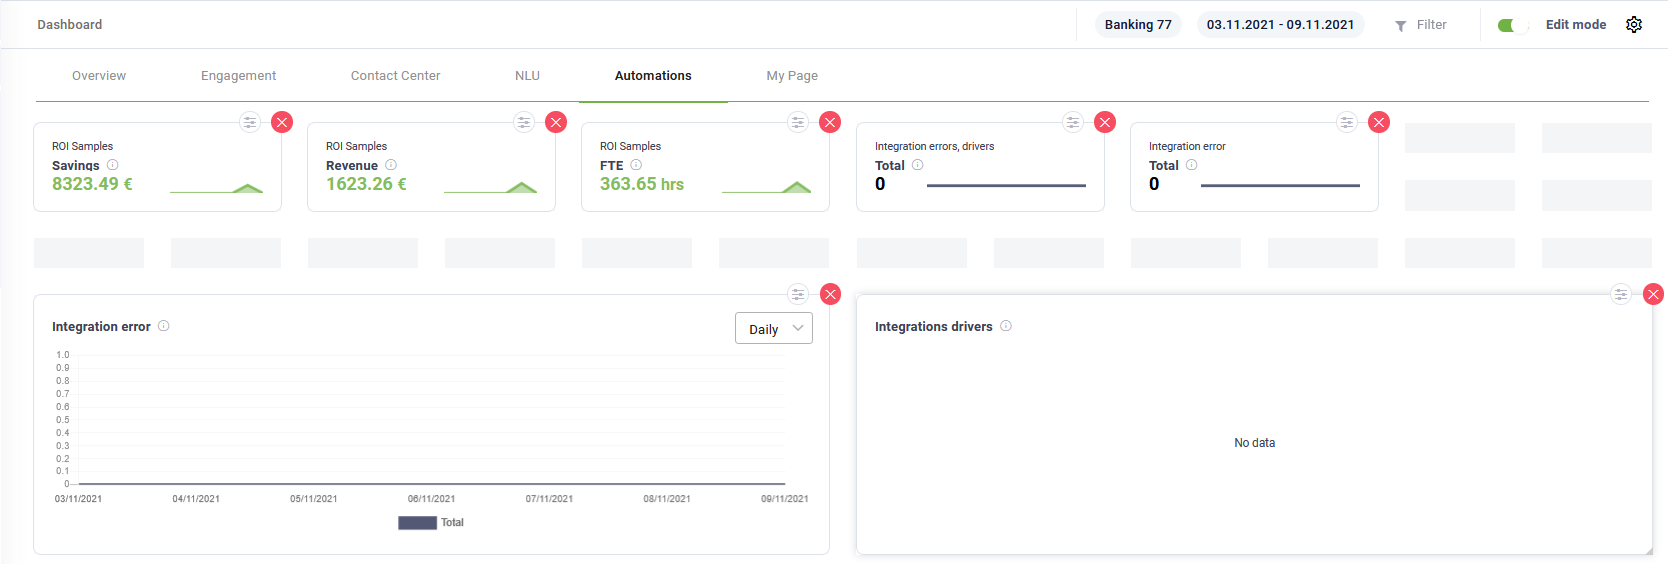
To edit the dashboard template, on the top-right corner of the Dashboard, tap on Edit mode.

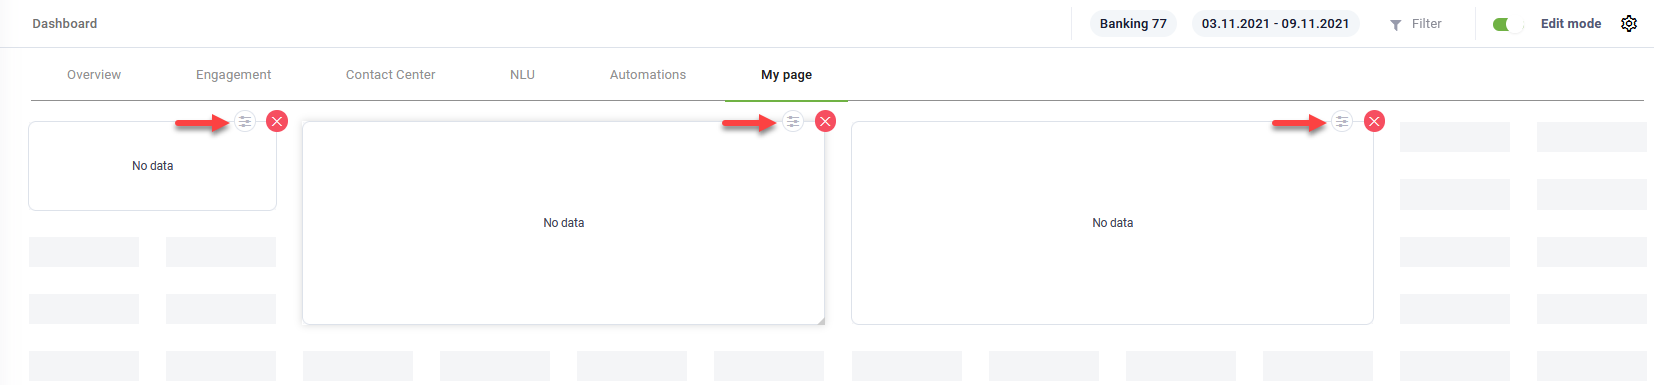
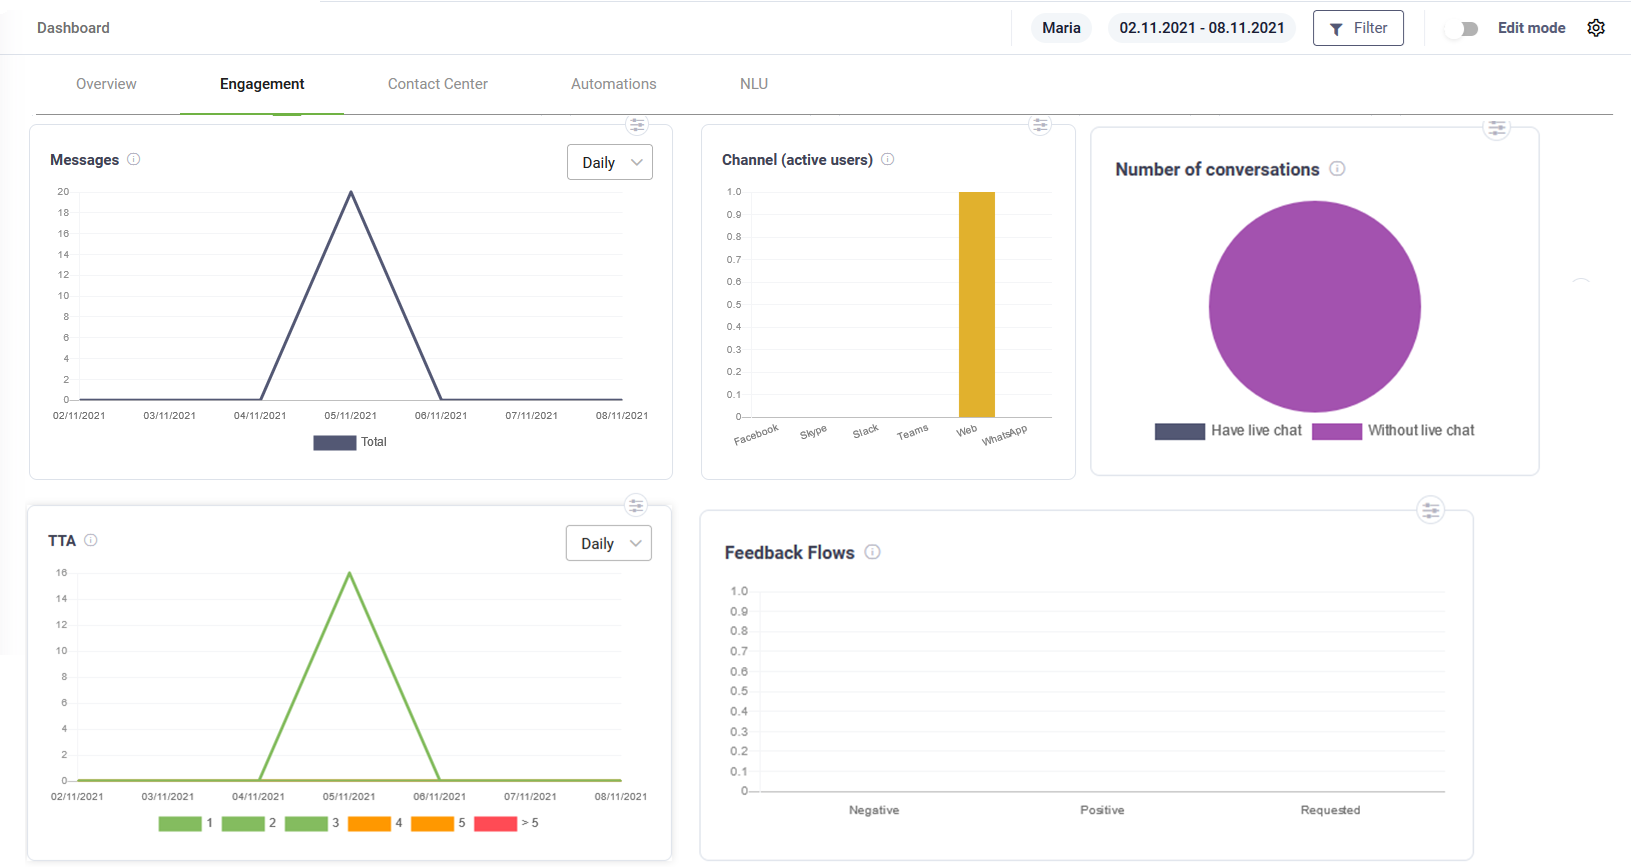
The Dashboard becomes editable: a toolbar appears at the bottom and all dashboard widgets become editable. You can navigate through dashboard pages and edit the dashboard pages according to your needs.
The toolbar provides you with the following options:
|
|
Add a new widget on the dashboard page. |
|
|
Add a new dashboard page. Useful when you want to have your custom KPIs on the same page. |
|
|
Rename the current dashboard page. |
|
|
Delete the current dashboard page. Important! This action cannot be undone. Make sure that you really want to delete the current dashboard page.
|
|
|
Restores the current page to default dashboard template. Important! This action cannot be undone; any customizations you did to the current page will be lost! Make sure that you really want to restore the dashboard page to default.
|
|
|
Saves the current dashboard page customization and exists the edit mode. |
|
|
Cancels dashboard page customizations (new or existing widgets, reordering, etc.) and exists the edit mode. |


Adding widgets
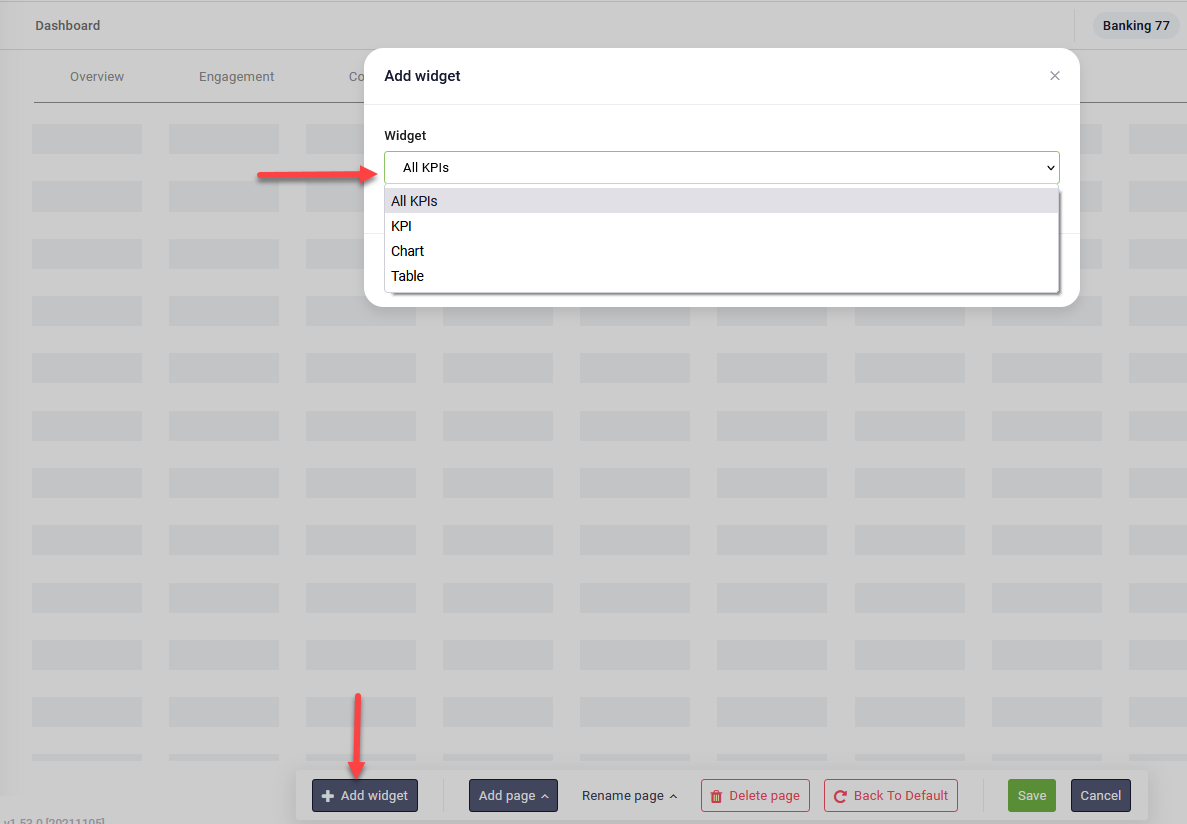
To add a widget, click the Add widget button ( ) on the toolbar. The Add widget page appears.
Select the desired widget type:
- All KPIs – adds all KPIs: Druid predefined or custom KPIs.
- KPI – to show a simple KPI element.
- Chart – to show elements/ time series KPIs in a chart.
- Table – to show elements/time series KPIs in a table.
Click Save. Except for All KPIs, the widgets are empty.
You need to edit the widget based on the selected widget type. The next section describes how to edit various types of widgets.
Editing widgets
To edit a widget, click the settings icon corresponding to the desired widget.
The widget Settings page appears. The page content is different based on the widget type. This section provides you with information on how to set up new widgets based on their type:
- KPI Widgets – display simple KPI values.
- Chart Widgets – show in a chart the KPI values over time (time series KPIs) or the KPI values as simple elements.
- Table Widgets – show KPI values in a table.
Edit KPI widgets
In the Settings page, select the desired metric (Metric Name), the KPI (Metric Display Name) and the Trend Chart, that is, the way you want to view KPI data on the widget (Daily/Weekly/Monthly).
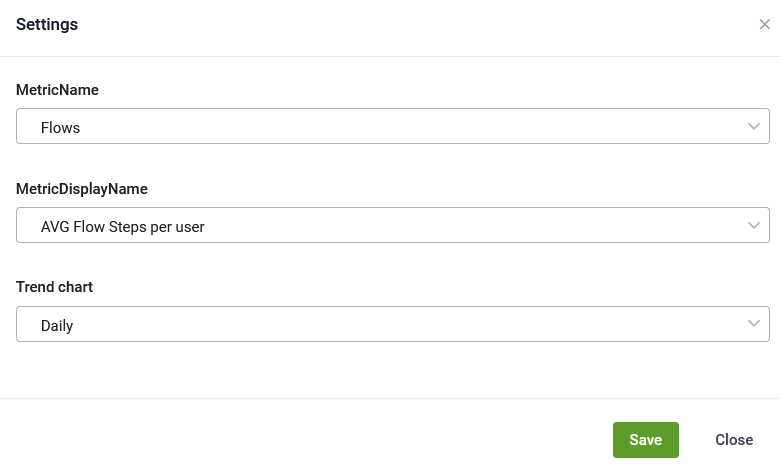
Click Save.
On the dashboard, you can now see the widget details and the KPI.
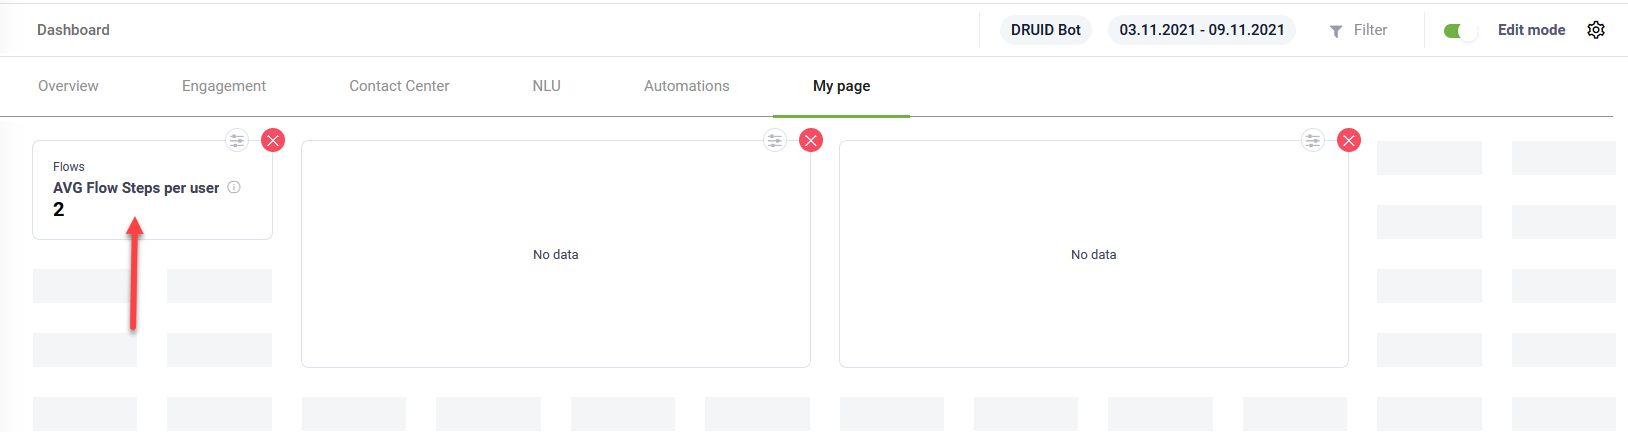
Click the Save button from the dashboard toolbar to save the widget on the dashboard page.
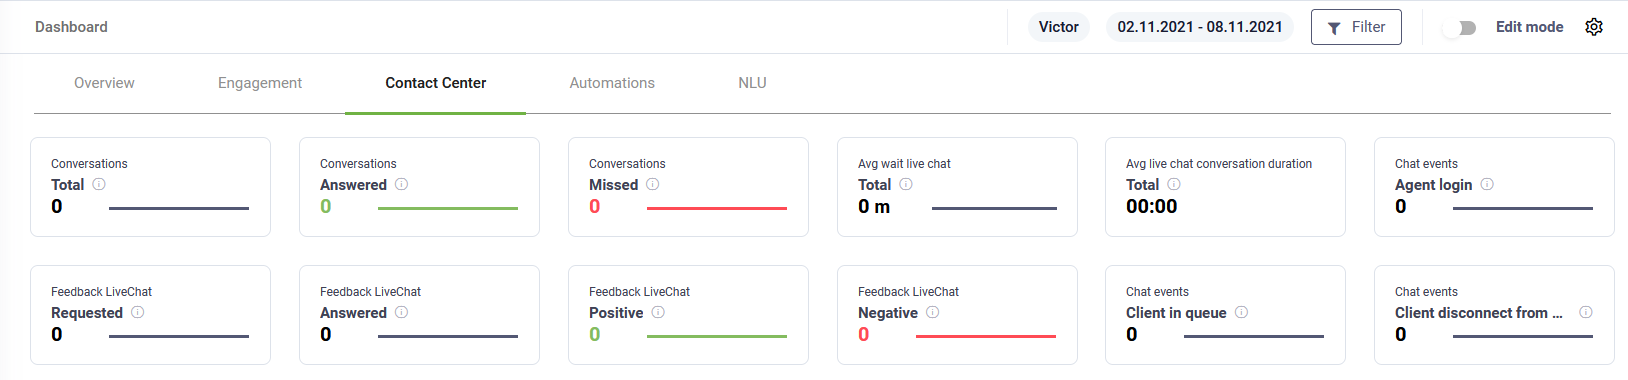
The figure below provides an example of various widgets of type KPI.
Edit Chart widgets
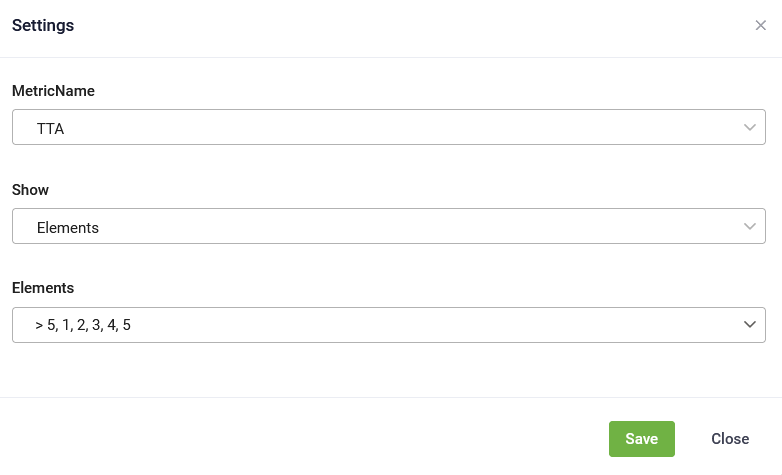
To customize a chart widget, in the widget Settings page:
- Select the Chart Type: Line, Bar or Pie.
- In DRUID 8.11 and later, you can enable the Display side by side option for bar charts to show values as separate bars instead of stacking them. This makes comparisons easier, improves data clarity, and helps you quickly analyze insights.
- Select the Metric Name.
- From the Show field select how you want Druid to show the KPI values on the dashboard: as elements or time series.
- From the Elements field, select the KPI elements you want to show on the chart.
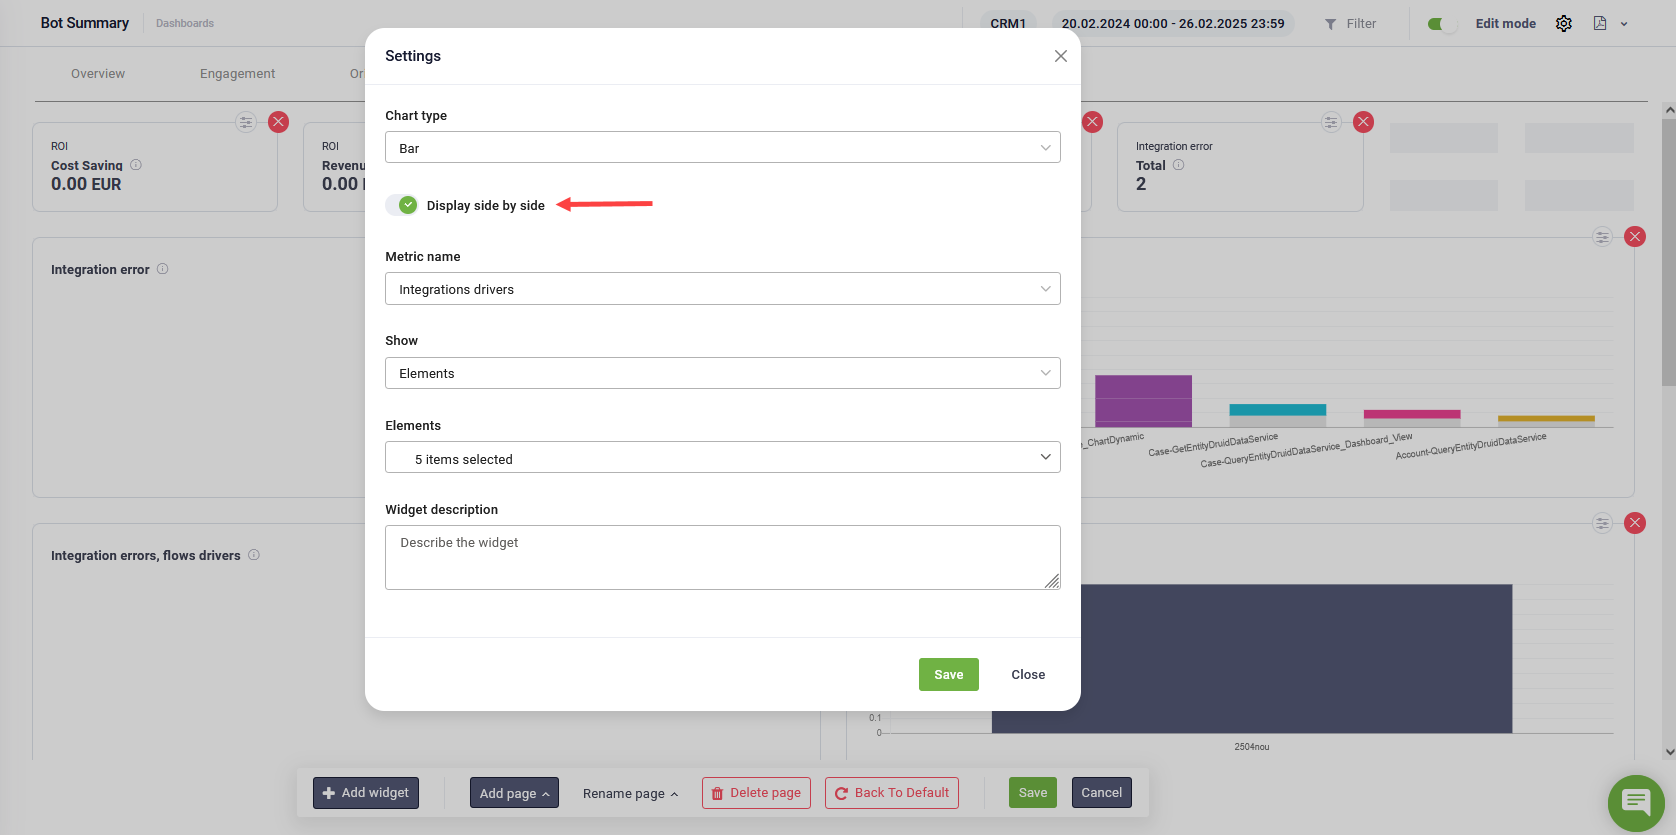
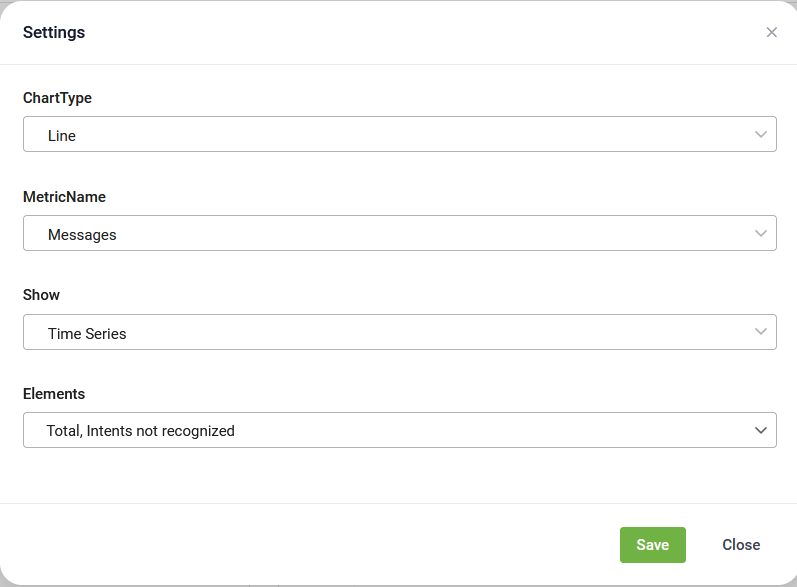
Click Save.
On the dashboard, you can now see the widget details and the KPI.
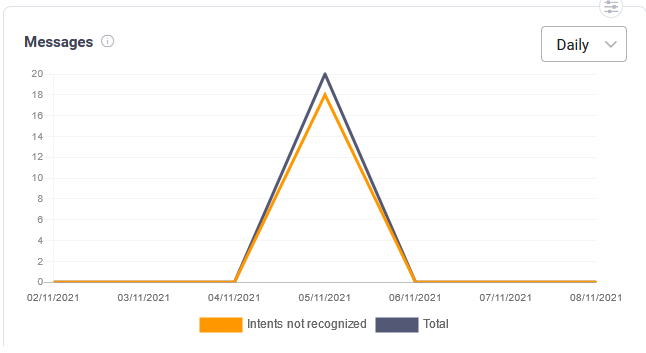
Time series example
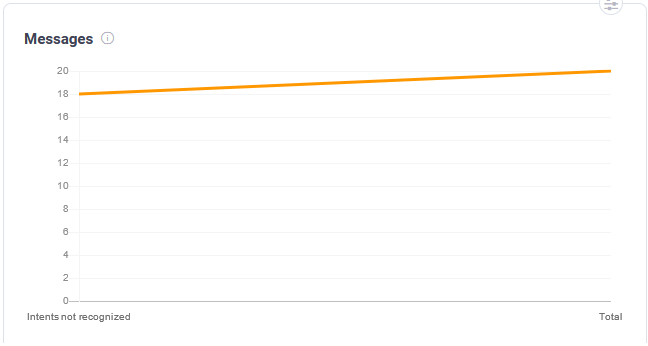
Elements example
Click the Save button from the dashboard toolbar to save the widget on the dashboard page.
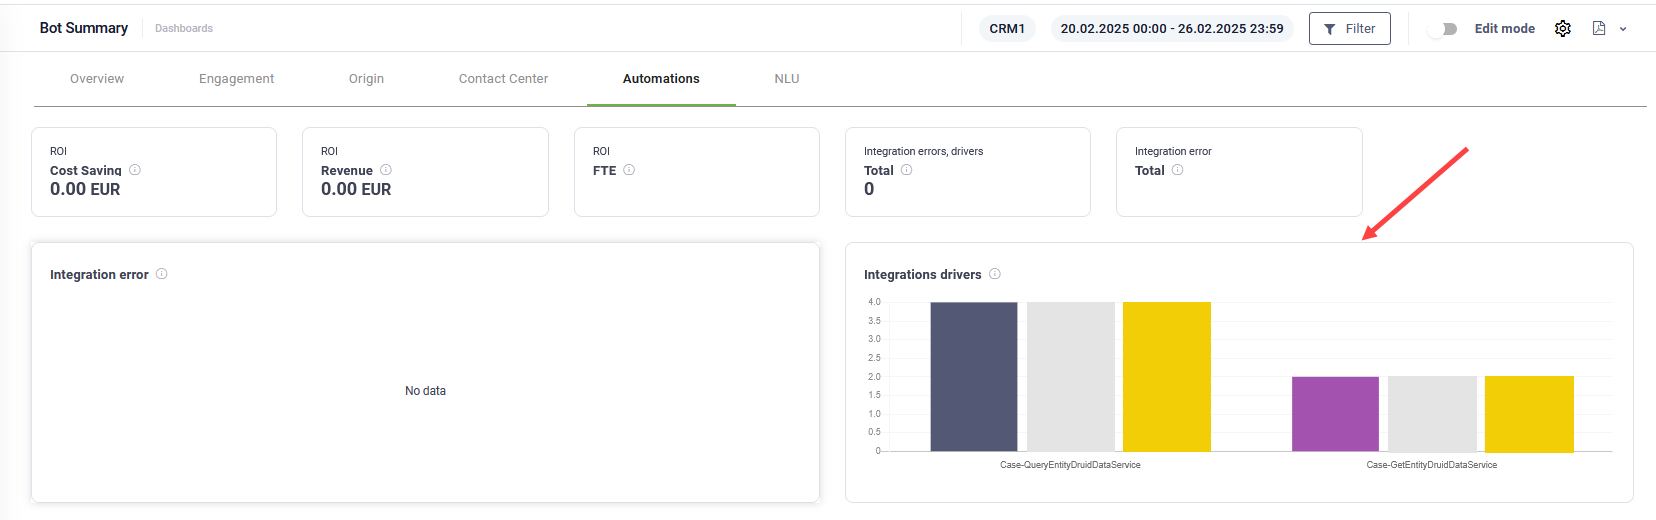
The figure below provides an example of various widgets of type Chart.
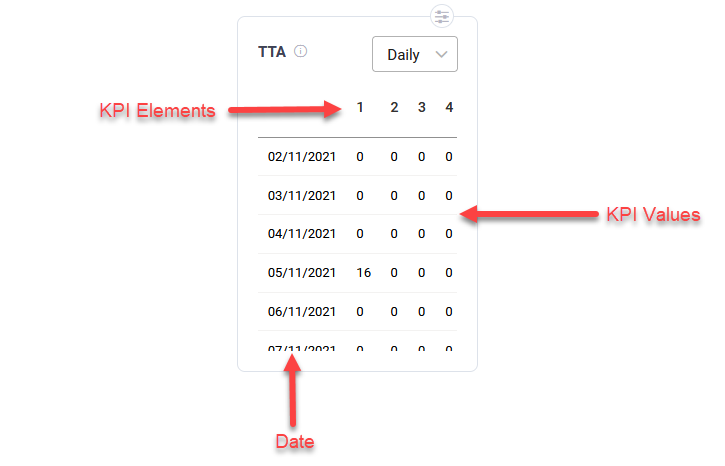
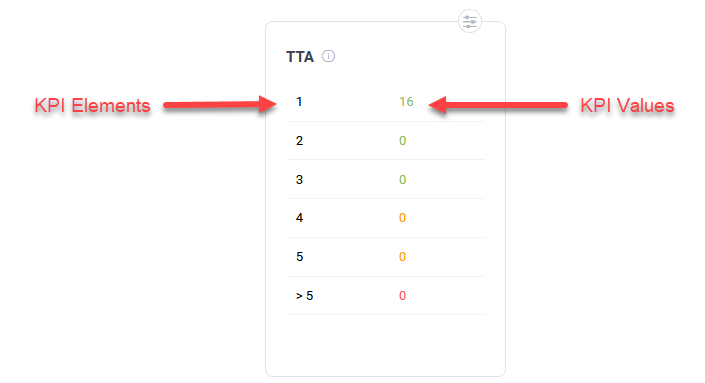
Edit Table widgets
Table widgets provide you with the possibility to show KPI data on the dashboard in a table format, both KPI elements and time series KPIs.
To customize a table widget, in the widget Settings page:
- Select the Chart Type: Line, Bar or Pie.
- Select the Metric Name.
- From the Show field select how you want Druid to show the KPI values in on the dashboard: per KPI elements or as time series.
- From the Elements field, select the KPI elements you want to show in the table.
Click Save.
On the dashboard, you can now see the widget details and the KPI.
Time series example
Elements example
Click the Save button from the dashboard toolbar to save the widget on the dashboard page.
Deleting widgets
To delete a widget from the current dashboard page, click the delete icon corresponding to the desired widget.
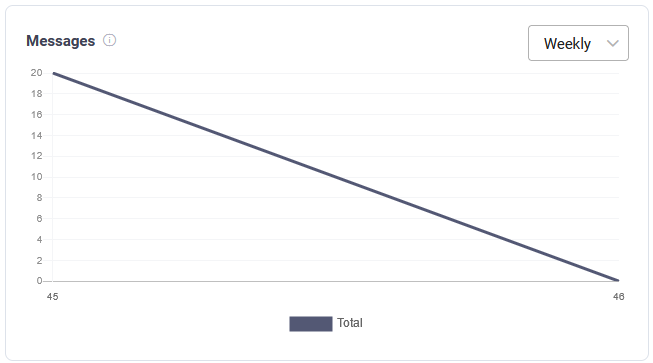
Changing the trend on time series widgets
By default, time series widgets (table or chart) display data metrics on a daily basis. You can view data on a weekly or monthly trend, as best suits your needs.
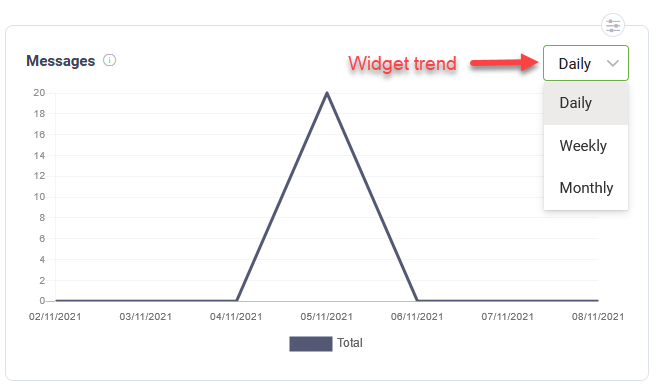
Druid automatically saves the widget trend change, so when accessing the dashboard next time, the widget will show data using the updated trend.
Reordering widgets on Dashboard
You can reorder the widgets on a dashboard page by using drag and drop and clicking the Save button on the toolbar.
Adding Dashboard Pages
To add a new dashboard page, click the Add page button ( ) from the toolbar. A pop-up appears. Type the name of the page and click Save.
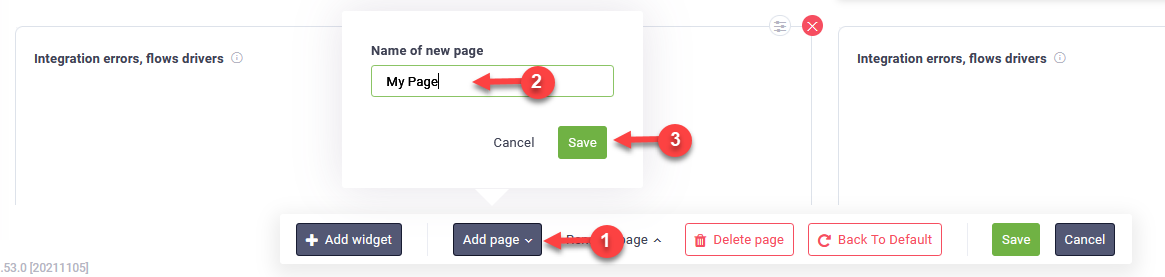
The page is added as a new tab to the dashboard but you remain on the current page.
Renaming Dashboard Pages
To rename the current dashboard page, click the Rename page button ( ) on the toolbar. A pop-up appears. Type the new name of the page and click Save.
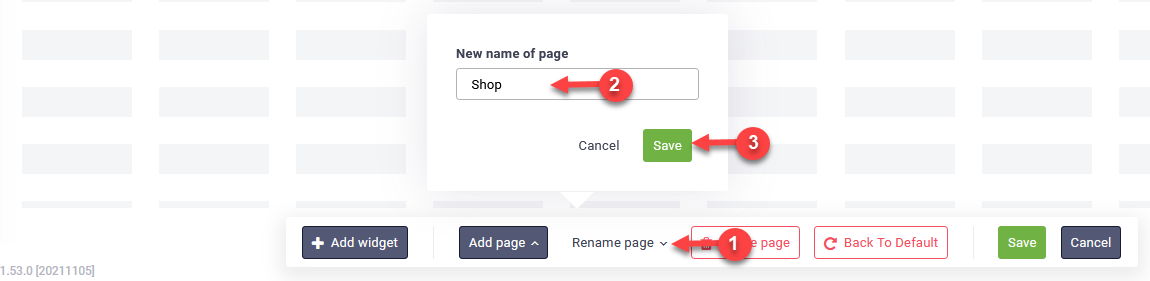
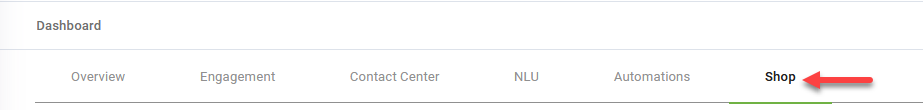
The new page name is saved.
Deleting Dashboard Pages
To delete the current dashboard page, click the Delete page button (  ) from the toolbar. A confirmation dialog appears.
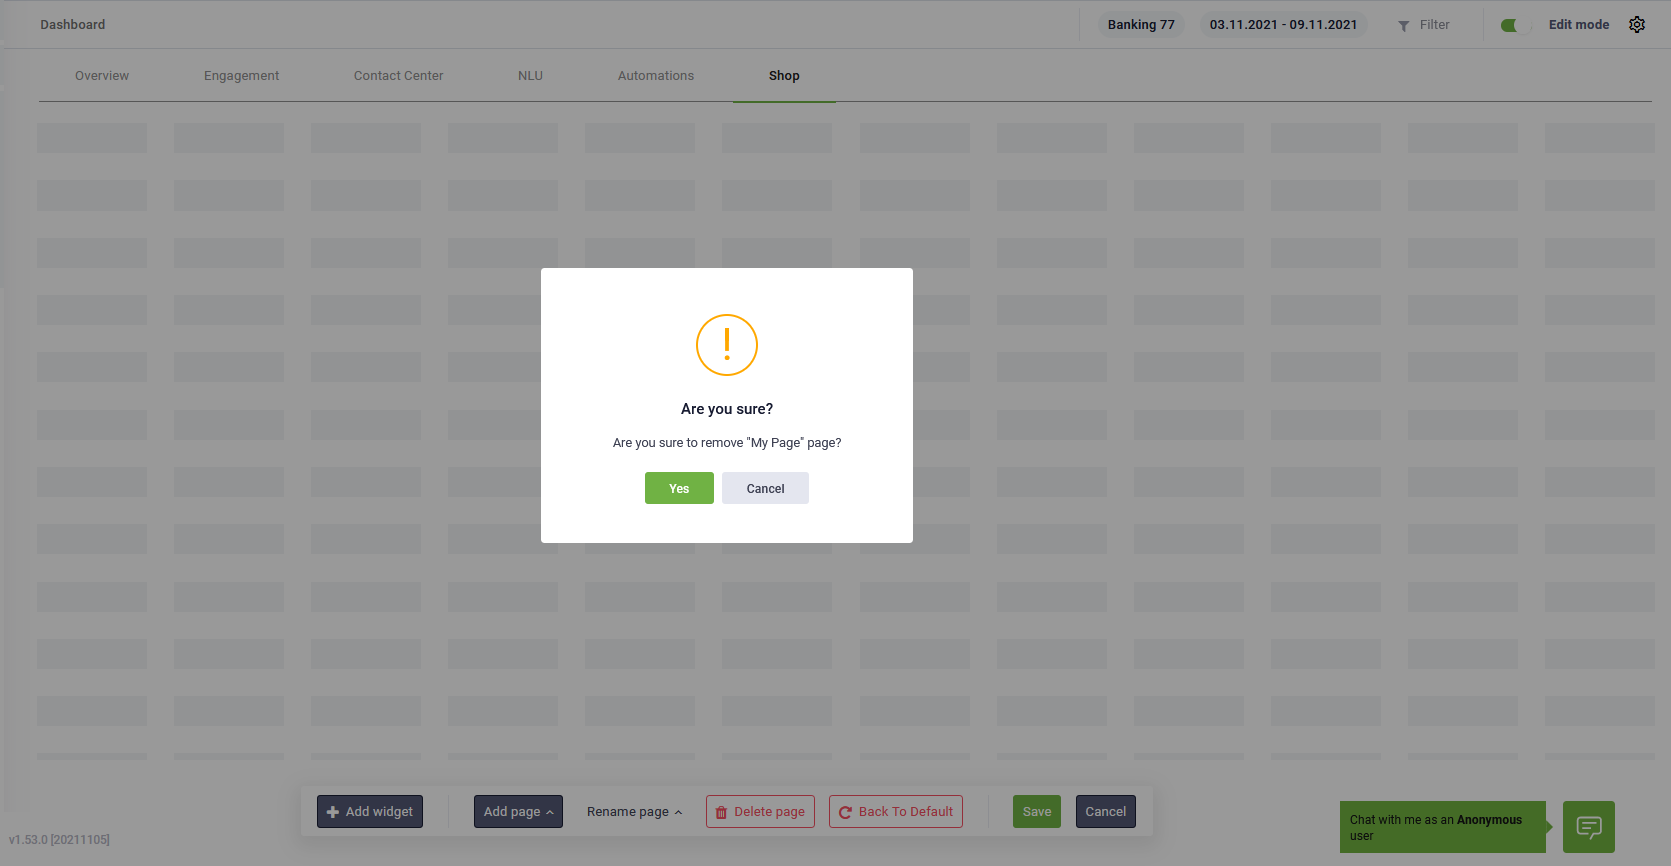
Click Yes. The current page is removed from the dashboard and the Dashboard Overview appears (in edit mode).
Restore to Dashboard template page
You can restore a customized dashboard page back to the dashboard template page by selecting the desired page (dashboard tab) and clicking the Back to Default button from the toolbar.
A pop appears asking you to confirm the action.
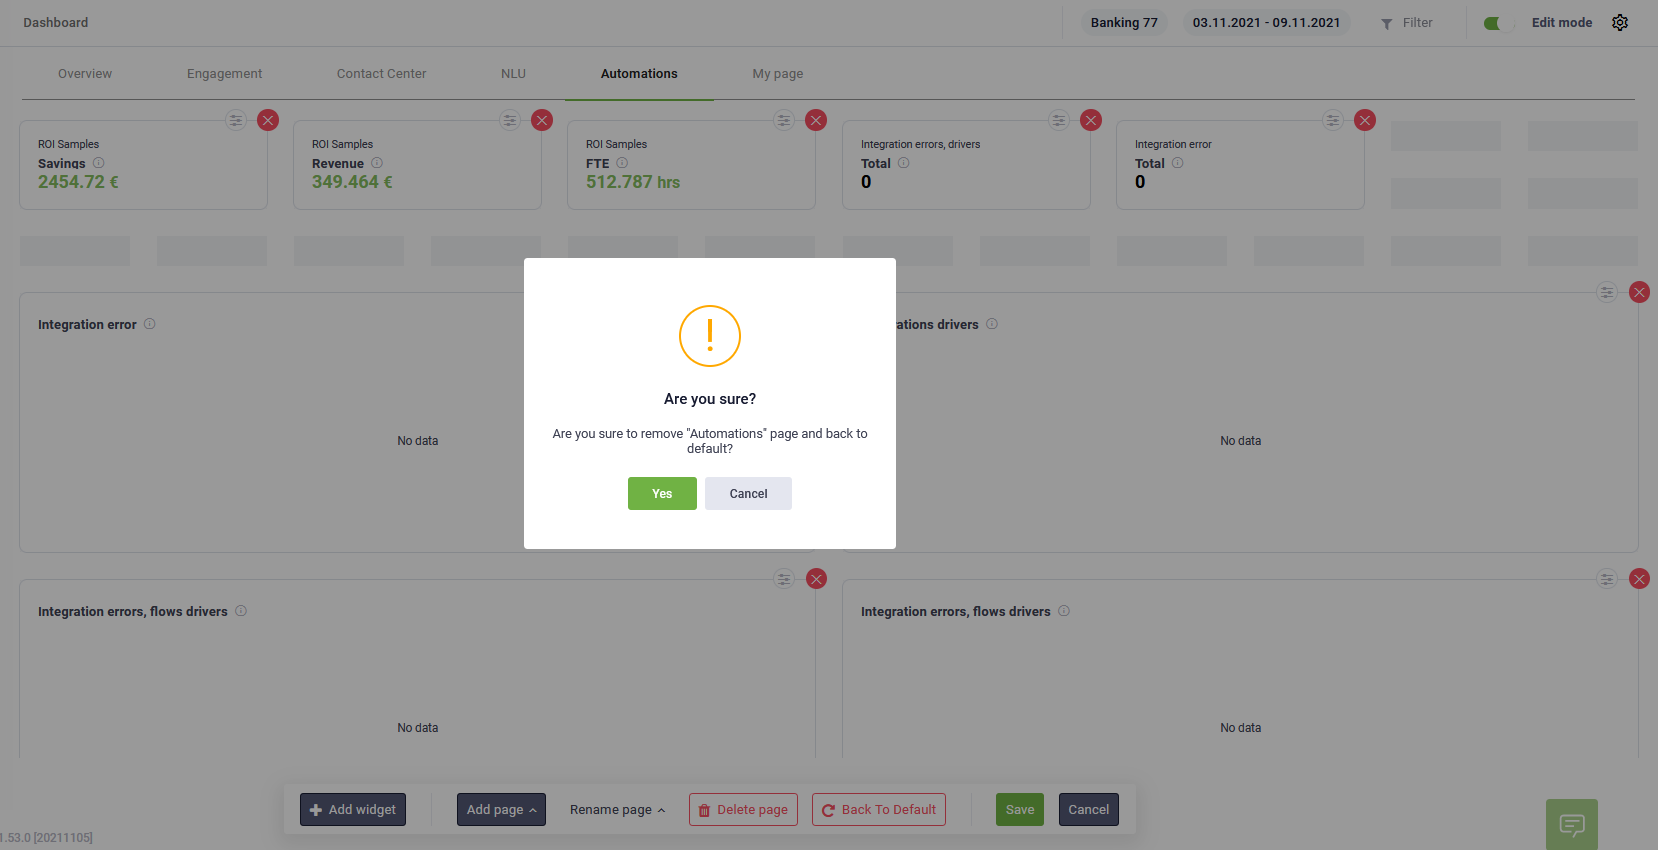
Click Yes.