Workspace Logs
Workspace logs enables authors to understand the workspace integration errors and be in the position to quickly edit and fix the errors.
View workspace logs
To view the workspace logs for a AI Agent:
- Select the AI Agent.
- From the History & Logs menu, click Workspace logs. The Workspace logs page appears.
- Choose the desired filtering options based on your needs and click Apply.
- At the top-right corner of the page, click Refresh
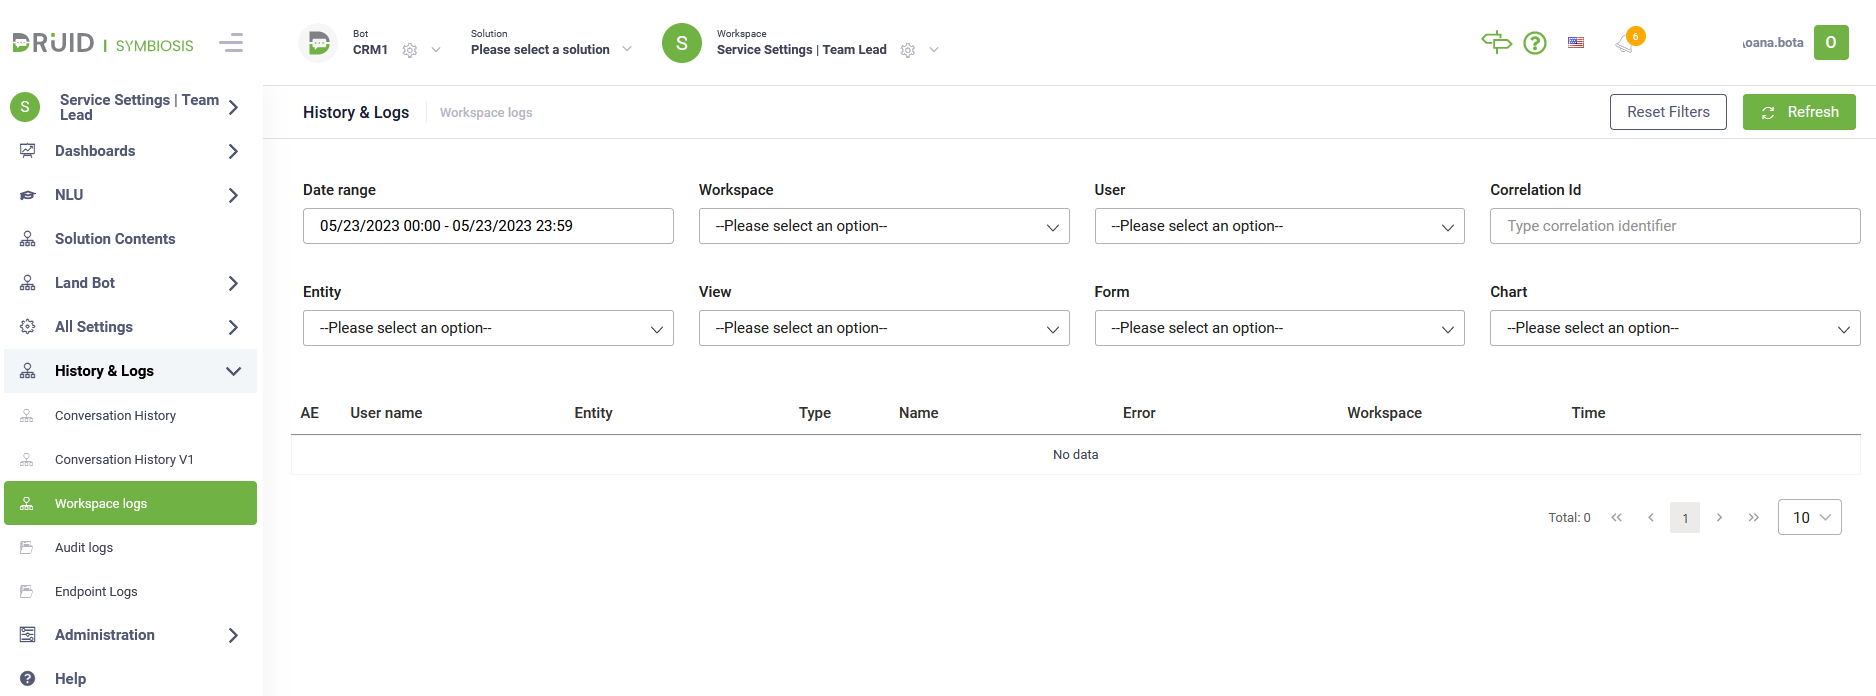
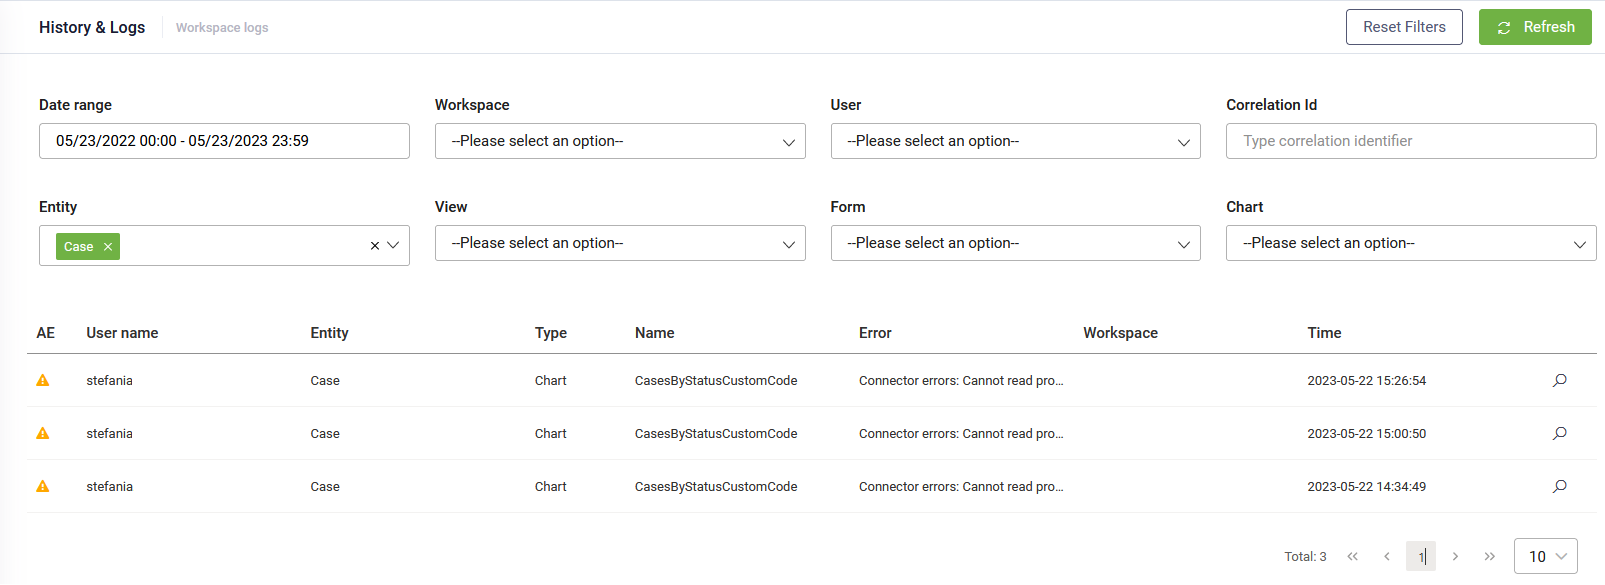
The table below the search criteria lists all the integration logs that occurred in the workspace(s) based on the selected filtering options.
Troubleshoot workspace logs
To view more details about a workspace log, in the logs table, click on the error you want to troubleshoot. The Workspace log details opens in a new browser tab and provides you with relevant information like where the event occurred and on which entity.
In the figure below, an error occurred on the chart "CasesByStatusCustomCode" defined on the entity "Case".
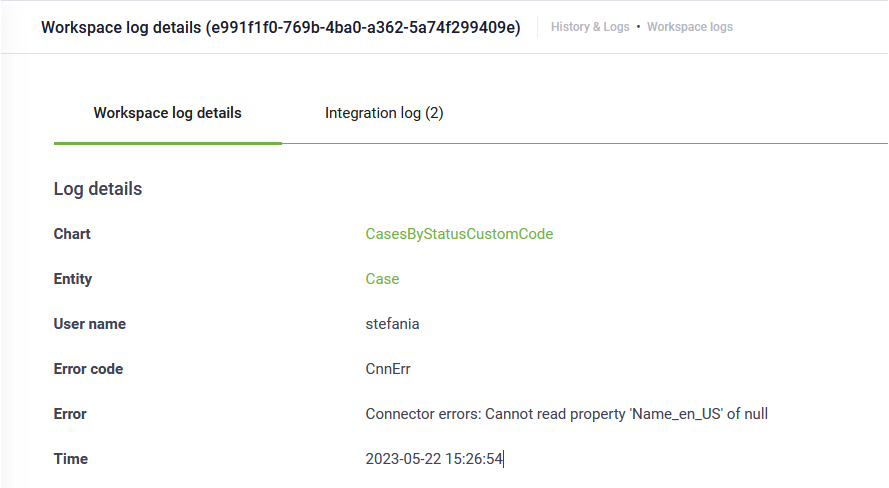
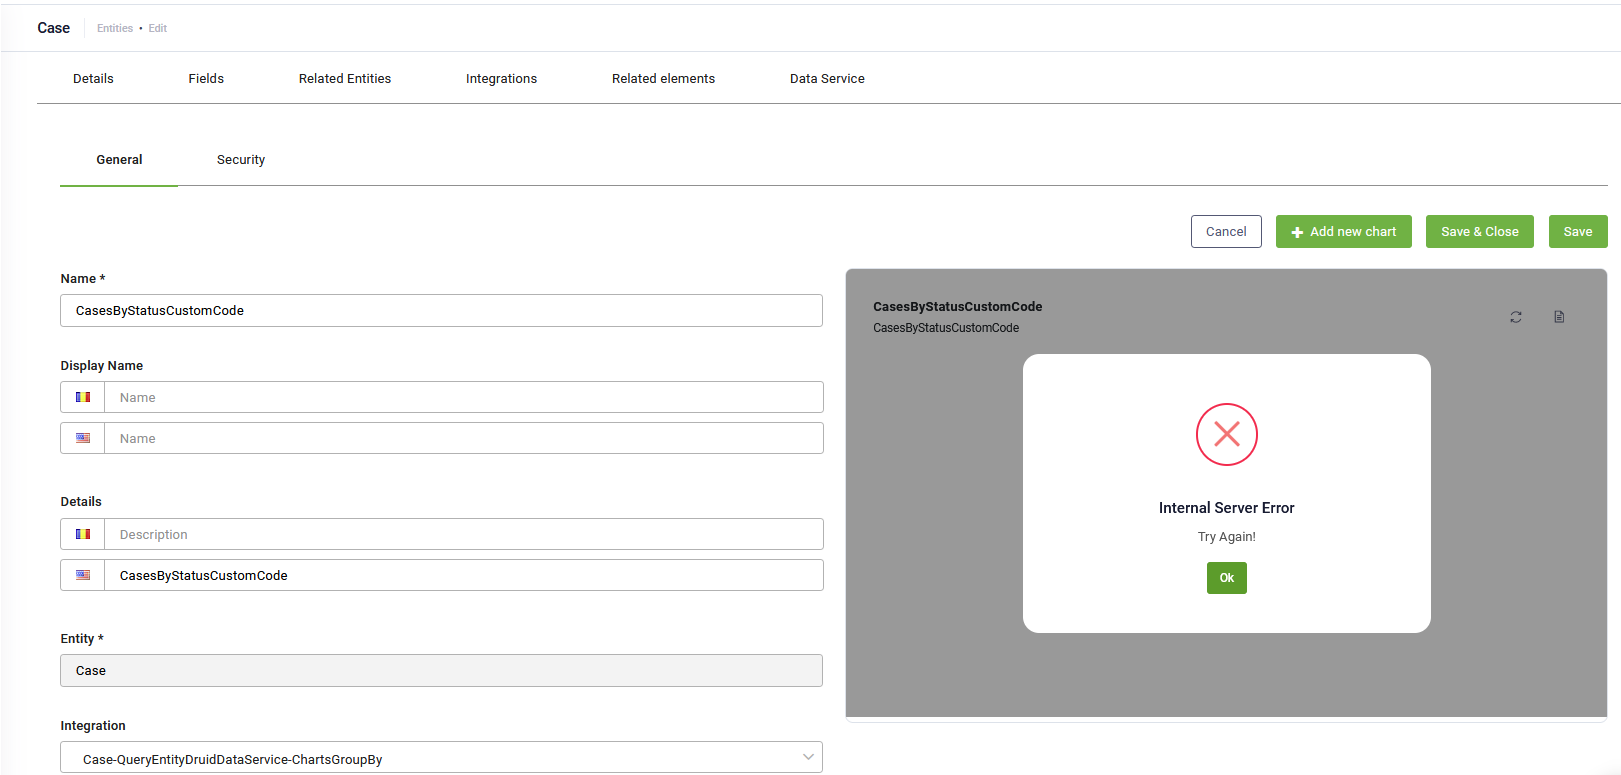
You can click both the entity name on which the error occurred and the workspace element where it occurred (chart, form, etc.). The links will open the specific page in a new browser tab (e.g., see the figure below).
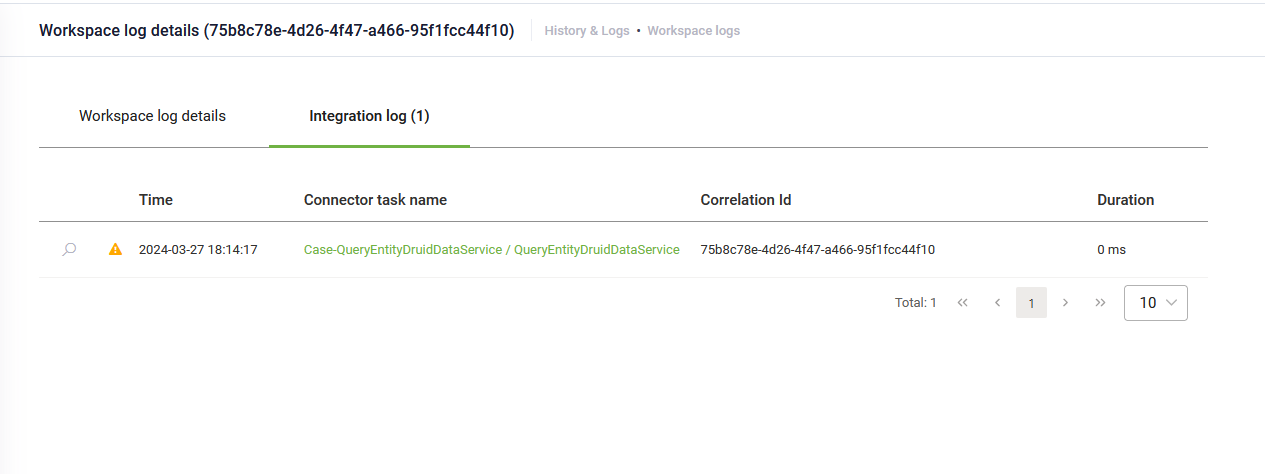
Click the Integration log tab. It displays the log of all integration calls on the current workspace element (chart, form, etc.).
You have two options to troubleshoot the integrations that have failed:
Drill-down into the connector integration
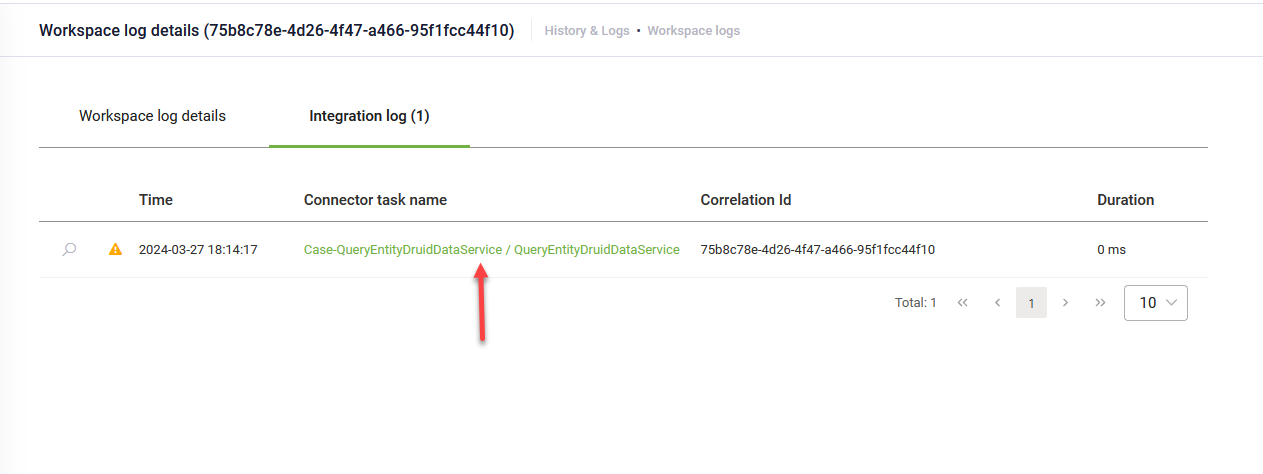
To access detailed information about a connector integration in the Integration log, simply click on the desired connector task name.
Once clicked, the Connector steps will be displayed, and any failed integration tasks will be marked with a red bar.
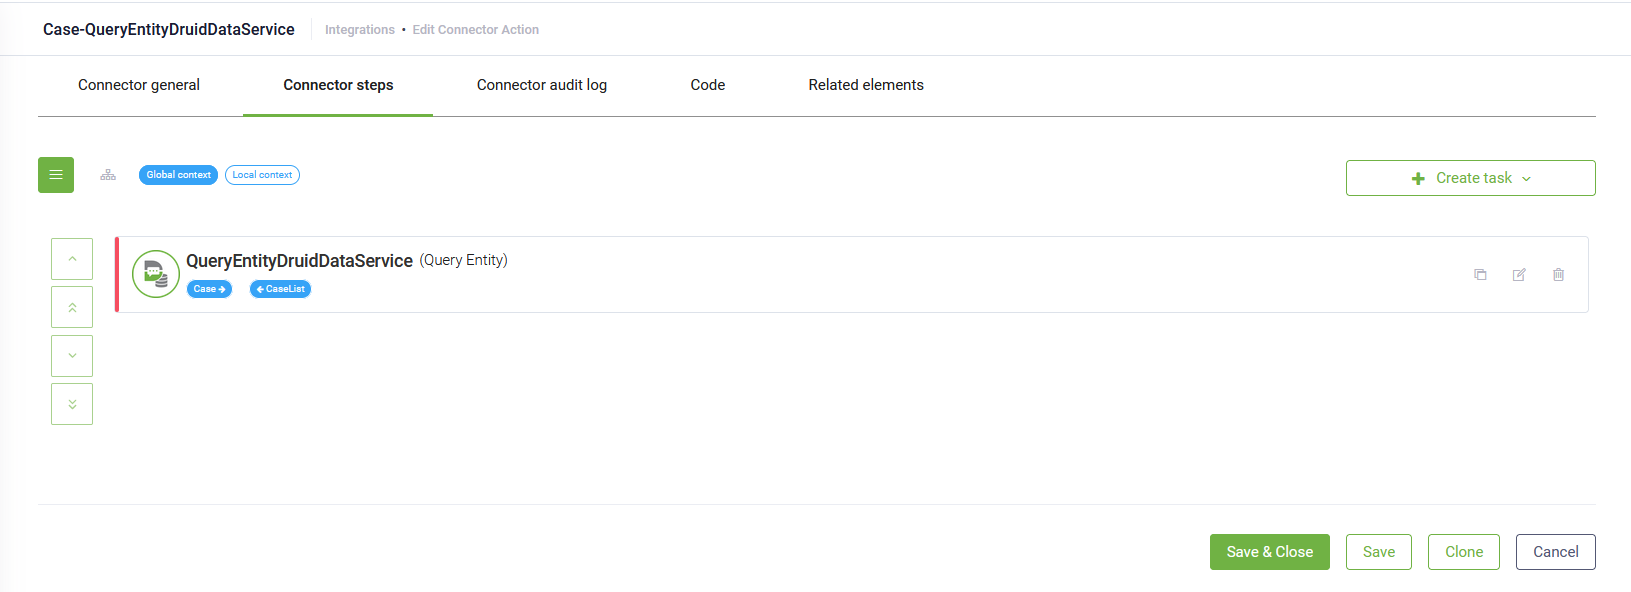
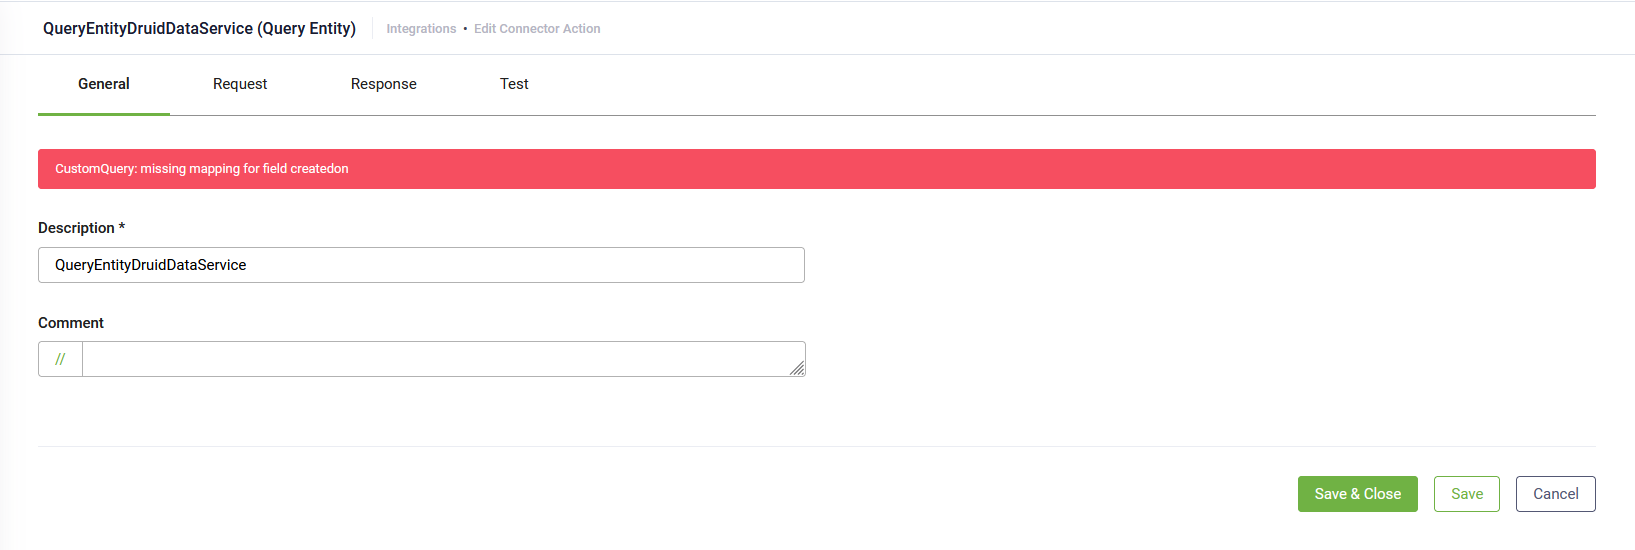
Click on the specific integration task, and on the integration details page, an error message will provide you with details regarding any misconfiguration. From there, you can take the necessary steps to correct them.
Verify the Integration log
To see the Integration log tails, click the magnifier icon ( ) displayed inline with the log entry.
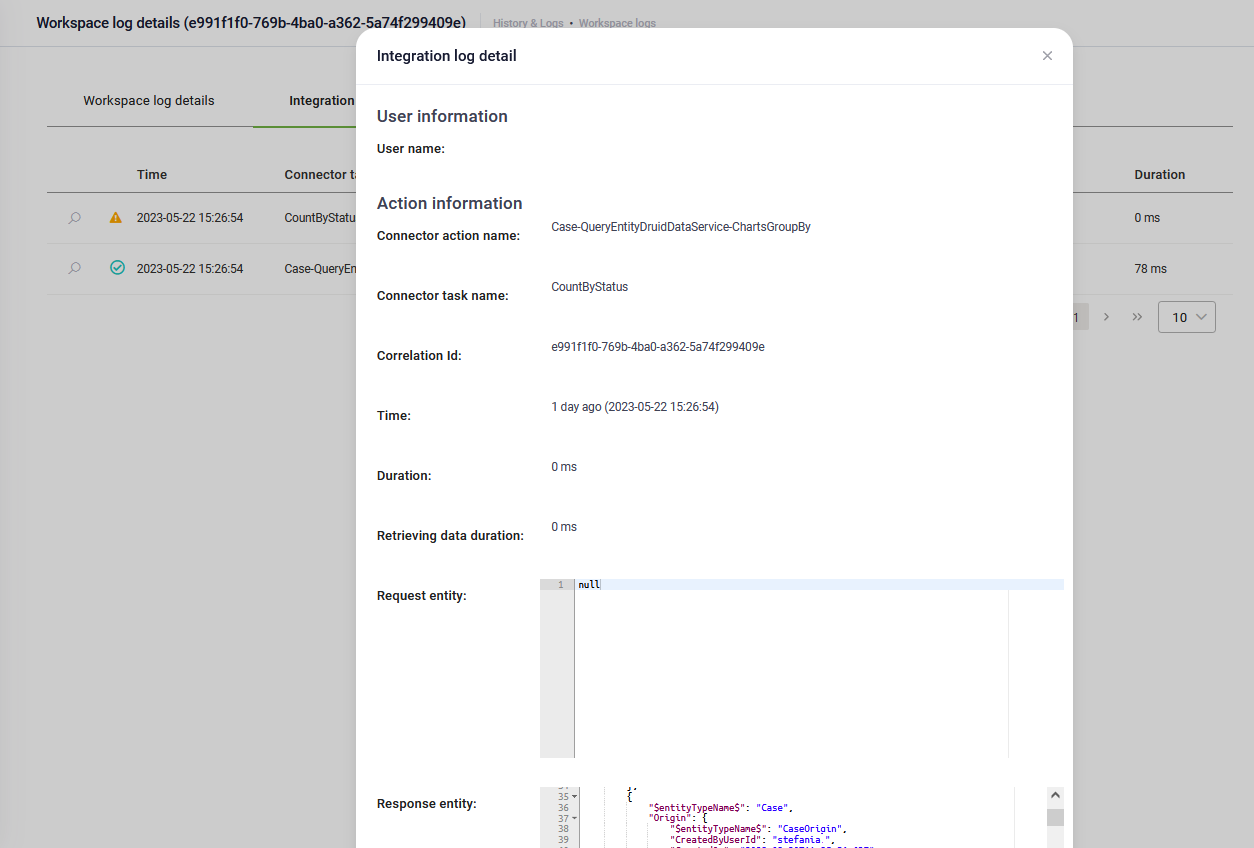
The Audit log details contains the following information:
- User Information
- Action Information – allows you to identify on which point the action failed.
- Error State – provides you with the error description.
To understand what went wrong, you need to read the Action Information in the following order:
- Request entity
- Request task. If the value in the Request task is null that means that the request action task has not been executed.
- Response task. If the value in the Response task is null, that means that no response was received from the 3rd party system.
- Response entity.
If the Request task is “null”, check the Error State, there might be something wrong in the integration request.
If all four fields contain data other than null, that means that there was something wrong mapping the response data to the Response Entity.
You can